

Refer to the Baseball 2018 data, which reports information on the 2018 Major League Baseball season. Let
Question:
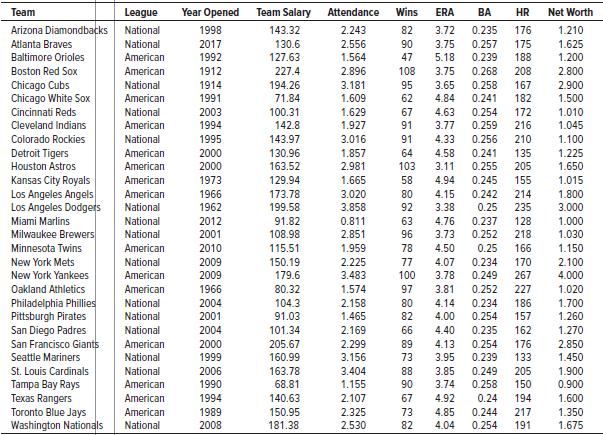
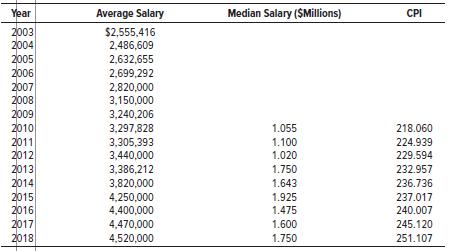
Refer to the Baseball 2018 data, which reports information on the 2018 Major League Baseball season. Let attendance be the dependent variable and total team salary be the independent variable. Determine the regression equation and answer the following questions.
a. Draw a scatter diagram. From the diagram, does there seem to be a direct relationship between the two variables?
b. What is the expected attendance for a team with a salary of $100.0 million?
c. If the owners pay an additional $30 million, how many more people could they expect to attend?
d. At the .05 significance level, can we conclude that the slope of the regression line is positive? Conduct the appropriate test of hypothesis.
e. What percentage of the variation in attendance is accounted for by salary?
f. Determine the correlation between attendance and team batting average and between attendance and team ERA. Which is stronger? Conduct an appropriate test of hypothesis for each set of variables.
Data From Baseball 2018:
Step by Step Answer:
a There does seem to be a direct relationship between the variables b The regression analysis of att...View the full answer


Statistical Techniques In Business And Economics
ISBN: 9781260239478
18th Edition
Authors: Douglas Lind, William Marchal, Samuel Wathen
