

The North Valley Real Estate data reports information on homes on the market. a. Let selling price
Question:
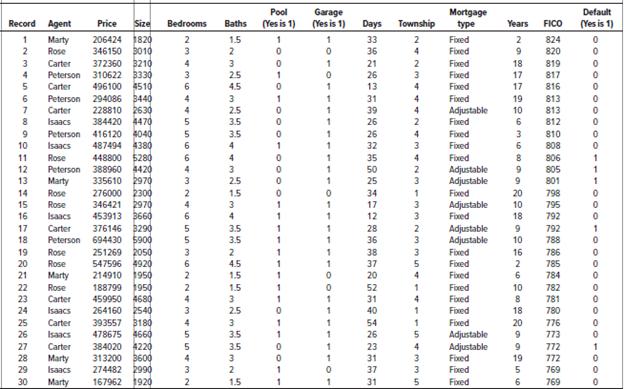
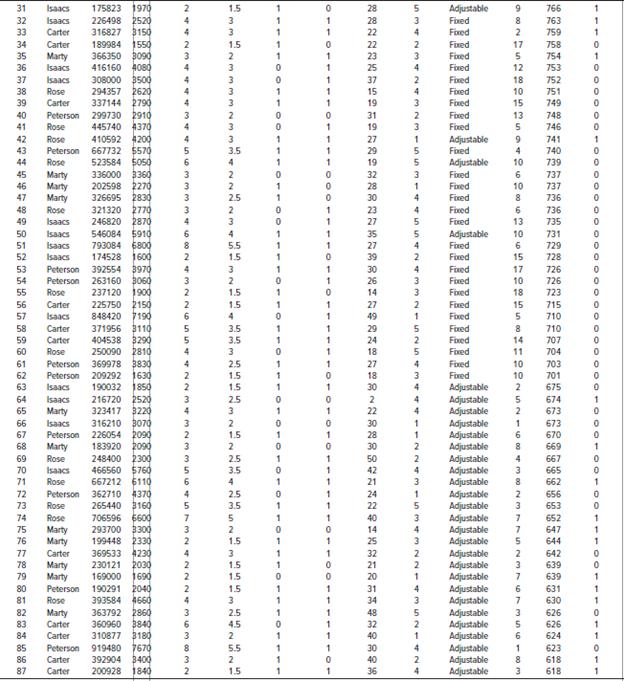
The North Valley Real Estate data reports information on homes on the market.
a. Let selling price be the dependent variable and size of the home the independent variable. Determine the regression equation. Estimate the selling price for a home with an area of 2,200 square feet. Determine the 95% confidence interval for all 2,200-square-foot homes and the 95% prediction interval for the selling price of a home with 2,200 square feet.
b. Let days-on-the-market be the dependent variable and price be the independent variable. Determine the regression equation. Estimate the days-on-the-market of a home that is priced at $300,000. Determine the 95% confidence interval of days on the market for homes with a mean price of $300,000, and the 95% prediction interval of days-on-the-market for a home priced at $300,000.
c. Can you conclude that the independent variables “days on the market” and “selling price” are positively correlated? Are the size of the home and the selling price positively correlated? Use the .05 significance level. Report the p-value of the test. Summarize your results in a brief report.
Data From North Valley Real Estate:
Step by Step Answer:
a Using a statistical software package the regression equation is price 1577595 10836 size of the ho...View the full answer


Statistical Techniques In Business And Economics
ISBN: 9781260239478
18th Edition
Authors: Douglas Lind, William Marchal, Samuel Wathen
