

Refer to the following diagram. a. What is the graph called? b. Estimate the median, and first
Question:
Refer to the following diagram.
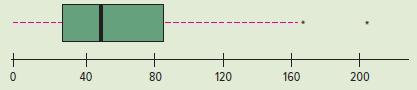
a. What is the graph called?
b. Estimate the median, and first and third quartile values.
c. Is the distribution positively skewed? Tell how you know.
d. Are there any outliers? If yes, estimate these values.
e. Can you determine the number of observations in the study?
Fantastic news! We've Found the answer you've been seeking!
Step by Step Answer:
Answer a The graph is called a box plot b The median ...View the full answer

Answered By
BillClinton Muguai
I have been a tutor for the past 5 years. I have experience working with students in a variety of subject areas, including computer science, math, science, English, and history. I have also worked with students of all ages, from elementary school to college. In addition to my tutoring experience, I have a degree in education from a top university. This has given me a strong foundation in child development and learning theories, which I use to inform my tutoring practices.
I am patient and adaptable, and I work to create a positive and supportive learning environment for my students. I believe that all students have the ability to succeed, and it is my job to help them find and develop their strengths. I am confident in my ability to tutor students and help them achieve their academic goals.
0 Reviews
10+ Question Solved
Related Book For 

Statistical Techniques In Business And Economics
ISBN: 9781260239478
18th Edition
Authors: Douglas Lind, William Marchal, Samuel Wathen
Question Posted:
