

The box plot below shows the amount spent for books and supplies per year by students at
Question:
The box plot below shows the amount spent for books and supplies per year by students at four-year public colleges.
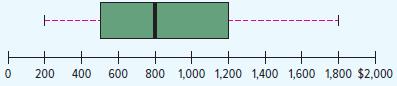
a. Estimate the median amount spent.
b. Estimate the first and third quartiles for the amount spent.
c. Estimate the interquartile range for the amount spent.
d. Beyond what point is a value considered an outlier?
e. Identify any outliers and estimate their values.
f. Is the distribution symmetrical or positively or negatively skewed?
Fantastic news! We've Found the answer you've been seeking!
Step by Step Answer:
a 800 b Q 1 500 Q 3 1200 c 700 found ...View the full answer

Answered By
PALASH JHANWAR
I am a Chartered Accountant with AIR 45 in CA - IPCC. I am a Merit Holder ( B.Com ). The following is my educational details.
PLEASE ACCESS MY RESUME FROM THE FOLLOWING LINK: https://drive.google.com/file/d/1hYR1uch-ff6MRC_cDB07K6VqY9kQ3SFL/view?usp=sharing
3+ Reviews
10+ Question Solved
Related Book For 

Statistical Techniques In Business And Economics
ISBN: 9781260239478
18th Edition
Authors: Douglas Lind, William Marchal, Samuel Wathen
Question Posted:
