Question:
Refer to the North Valley real estate data recorded on homes sold during the last year. Prepare a report on the selling prices of the homes based on the answers to the
following questions.
a. Compute the minimum, maximum, median, and the first and the third quartiles of price. Create a box plot. Comment on the distribution of home prices.
b. Develop a scatter diagram with price on the vertical axis and the size of the home on the horizontal. Is there a relationship between these variables? Is the relationship direct or indirect?
c. For homes without a pool, develop a scatter diagram with price on the vertical axis and the size of the home on the horizontal. Do the same for homes with a pool. How do the relationships between price and size for homes without a pool and homes with a pool compare?
Data From North Valley:
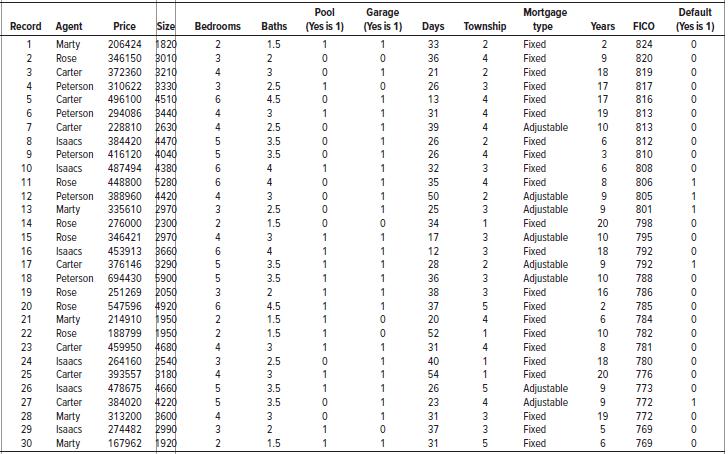
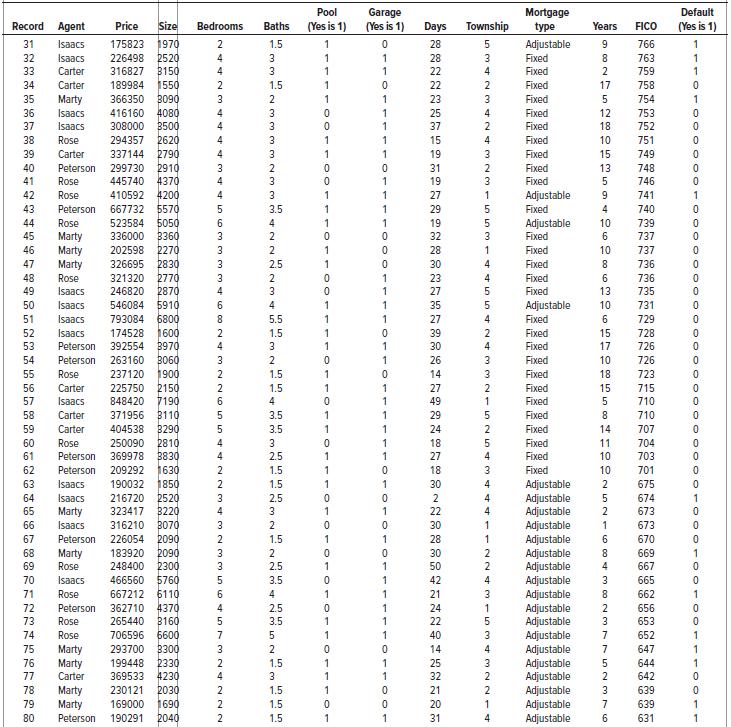
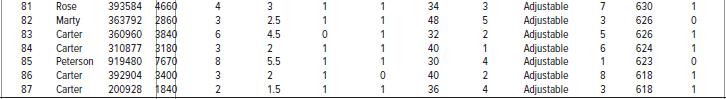
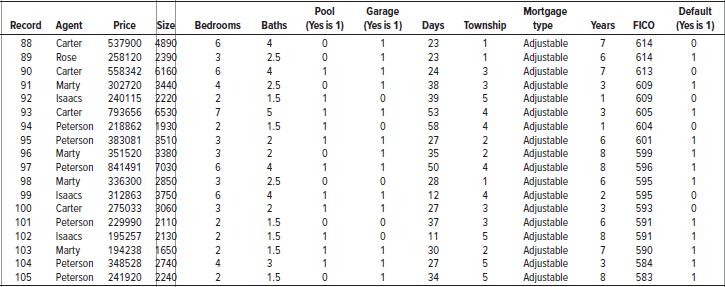
Transcribed Image Text:
Default (Yes is 1) Pool Garage (Yes is 1) Mortgage type Record Agent Price Size Bedrooms Baths (Yes is 1) Days Township Years FICO 1970 2520 3150 1550 3090 4080 3500 2620 2790 2910 4370 4200 5570 5050 3360 2270 2830 2770 2870 5910 6800 1600 3970 B060 1900 2150 7190 B110 3290 2810 3830 1630 1850 2520 3220 B070 2090 2090 2300 5760 6110 4370 B160 6600 3300 2330 4230 2030 1690 2040 31 Isaacs 175823 1.5 1 28 Adjustable 9 766 32 Isaacs 226498 4 3 1 28 3 Fixed 763 33 Carter 316827 4 3 1 1 22 4 Fixed 759 34 Carter 189984 2 1.5 1 22 2 Fixed 17 758 35 Marty 366350 3 1 1 23 3 Fixed 754 36 Isaacs 416160 3 1 25 4 Fixed 12 753 37 Isaacs 308000 4 3 1 37 Fixed 18 752 38 Rose 294357 3 1 15 4 Fixed 10 751 39 Carter 337144 4 3 1 1 19 3 Fixed 15 749 40 Peterson 299730 3 2 31 2 Fixed 13 748 41 Rose 445740 4 1 19 3 Fixed 746 42 Rose 410592 4 3 1 1 27 1 Adjustable 9. 741 43 Peterson 667732 3.5 29 Fixed 4 740 44 Rose 523584 6 1 1 19 Adjustable Fixed 10 739 45 Marty Marty Marty 336000 3 2 32 737 46 202598 3 2 1 28 Fixed 10 737 47 326695 3 2.5 1 30 4 Fixed 8. 736 48 Rose 321320 3 2 23 4 Fixed 6 736 49 Isaacs 246820 4 3 1 27 5 Fixed 13 735 50 Isaacs 546084 6 4 35 Adjustable 10 731 51 Isaacs 793084 8 5.5 1 27 4 Fixed 6 729 52 Isaacs 174528 2 1.5 1 39 2 Fixed 15 728 53 Peterson 392554 4 3 1 1 30 4 Fixed 17 726 54 Peterson 263160 3 2 1 26 3 Fixed 10 726 55 Rose 237120 2 1.5 1 14 3 Fixed 18 723 56 Carter 225750 2 1.5 1 1 27 2 Fixed Fixed 15 715 57 Isaacs 848420 6 1 49 710 58 Carter 371956 3.5 29 Fixed 8 710 59 Carter 404538 3.5 1 1 24 Fixed 14 707 60 Rose 250090 3 1 18 Fixed 11 704 61 Peterson 369978 4 2.5 1 1 27 4 Fixed 10 703 Fixed Adjustable Adjustable Adjustable Adjustable Adjustable Adjustable Adjustable Adjustable Adjustable Adjustable Adjustable Adjustable Adjustable Adjustable Adjustable Adjustable Adjustable Adjustable 62 Peterson 209292 2 1.5 1 18 10 701 63 Isaacs 190032 216720 2 1.5 1 30 4 2 675 64 Isaacs 3 2.5 2 4 674 1 65 Marty 323417 3 1. 22 4 673 66 Isaacs 316210 3 2 30 1 673 67 Peterson 226054 1.5 1 1 28 1 6. 670 68 Marty Rose 183920 3 30 2 8. 669 1 248400 466560 69 2.5 1 1 50 2 4 667 70 Isaacs 3.5 1 42 4 3 665 71 Rose 667212 6. 1 21 3. 8. 662 1 72 Peterson 362710 4 25 1 24 2 656 73 Rose 265440 3.5 1 22 3 653 74 Rose 706596 7 1 1 40 3. 7 652 75 Marty Marty Carter 293700 3 2 0. 14 4 7 647 76 199448 2 1.5 25 3 644 1 77 369533 4 3. 1 1 32 2 2 642 78 1.5 639 Marty Marty 230121 1 21 2 3 79 169000 2 1.5 20 7 639 80 Peterson 190291 2 1.5 1 1 31 4 6 631 1 in


