

Using the following time series data, respond to the following items. a. G raph the time series.
Question:
Using the following time series data, respond to the following items.
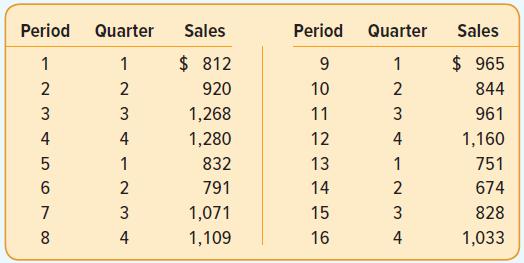
a. G raph the time series.
b. Based on the graph, describe the time series pattern.
c. For this time series, why is forecasting with a seasonally adjusted trend model appropriate?
d. E valuate a seasonally adjusted trend forecasting model. What is the MAD?
e. What are the quarterly indexes?
f. Forecast sales for future periods 17 through 20.
Fantastic news! We've Found the answer you've been seeking!
Step by Step Answer:
a b The quarterly time series shows two patterns negative trend and seasonality The ...View the full answer

Answered By
Pharashram rai
i am highly creative, resourceful and dedicated freelancer an excellent record of successful classroom presentations and writing . I have more than 4 years experience in tutoring students especially by using my note making strategies and engineering field . Especially adept at teaching methods of maths and writing , and flexible teaching style with the willingness to work beyond the call of duty. Committed to ongoing professional development and spreading the knowledge within myself to the blooming ones to make them fly with .
65+ Reviews
270+ Question Solved
Related Book For 

Statistical Techniques In Business And Economics
ISBN: 9781260239478
18th Edition
Authors: Douglas Lind, William Marchal, Samuel Wathen
Question Posted:
