

Using the data, respond to the following items. (The data is sourced from https://www.census.gov/retail/index.html#mrts, find Monthly Retail
Question:
Using the data, respond to the following items. (The data is sourced from https://www.census.gov/retail/index.html#mrts, find “Monthly Retail Trade Report,” and select “Time Series/Trend Charts” to find the data for many retail sectors of the economy.)
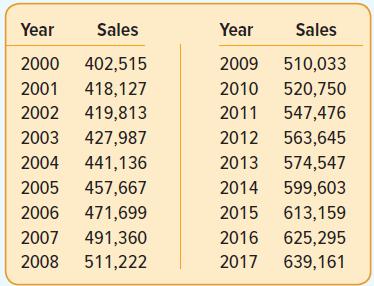
a. Plot the residuals associated with the trend model for these data.
b. T est for autocorrelation using the .05 significance level.
c. R eport and interpret your result.
Fantastic news! We've Found the answer you've been seeking!
Step by Step Answer:
a The graph indicates an initial downward trend followed by a...View the full answer

Answered By
Mugdha Sisodiya
My self Mugdha Sisodiya from Chhattisgarh India. I have completed my Bachelors degree in 2015 and My Master in Commerce degree in 2016. I am having expertise in Management, Cost and Finance Accounts. Further I have completed my Chartered Accountant and working as a Professional.
Since 2012 I am providing home tutions.
2+ Reviews
10+ Question Solved
Related Book For 

Statistical Techniques In Business And Economics
ISBN: 9781260239478
18th Edition
Authors: Douglas Lind, William Marchal, Samuel Wathen
Question Posted:
