

A college dean would like to know how well he can predict sophomore grade point average for
Question:
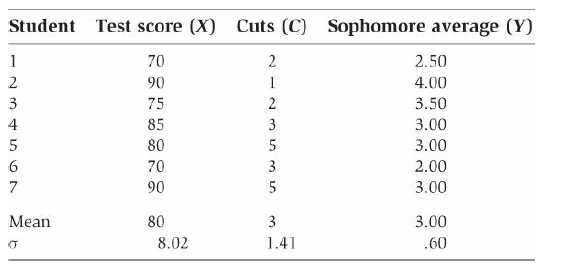
a. Convert the test scores (X) and sophomore averages (Y) to z scores. By inspection of the paired z scores, estimate whether the correlation between these two variables is strong and positive, about zero, or strong and negative. Then verify your estimate by computing r using the z score product formula.
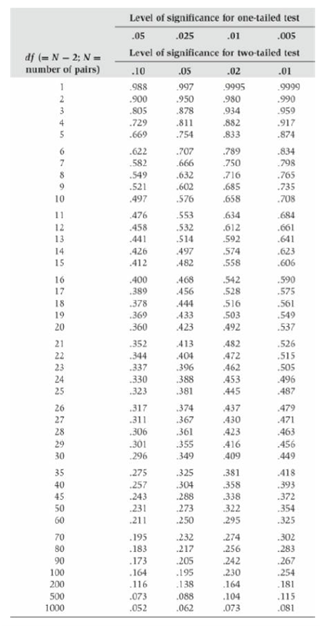
b. Use (raw-score) Formula 9.2 to compute the Pearson r between the number of cuts (C) and the sophomore average (Y). Can you reject the null hypothesis at the .05 level with a two-tailed test? (Use Table C.)
c. Repeat part (b) for the correlation between the number of cuts (C) and the test score (X). Is this correlation significant at the .01 level with a one-tailed test?
Formula 9.2
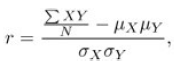
Table C
Step by Step Answer:
a This is a highly positive correlation which tells ...View the full answer


Introductory Statistics For The Behavioral Sciences
ISBN: 9780470907764
7th Edition
Authors: Joan Welkowitz, Barry H. Cohen, R. Brooke Lea
