

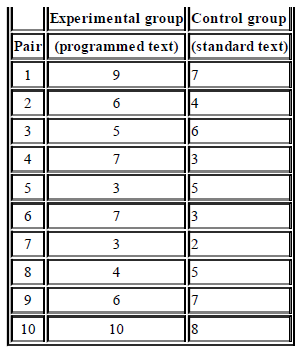
The data from Exercise 7 in Chapter 7 are reproduced in the following table. Calculate the mean
Question:
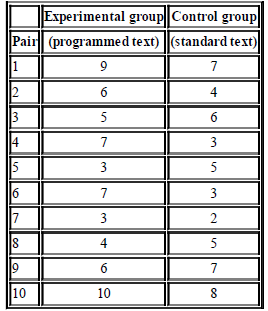
Data from exercise 7(chapter 7)
Test the results for statistical significance at the .05 level. What should the psychologist decide about his or her new programmed text?
Fantastic news! We've Found the answer you've been seeking!
Step by Step Answer:
Retain H 0 possible Type II ...View the full answer

Answered By
GERALD KAMAU
non-plagiarism work, timely work and A++ work
6+ Reviews
11+ Question Solved
Related Book For 
Introductory Statistics For The Behavioral Sciences
ISBN: 9780470907764
7th Edition
Authors: Joan Welkowitz, Barry H. Cohen, R. Brooke Lea
Question Posted:
