

The following MINITAB output presents the results of a power calculation for a test concerning a population
Question:
The following MINITAB output presents the results of a power calculation for a test concerning a population mean μ.
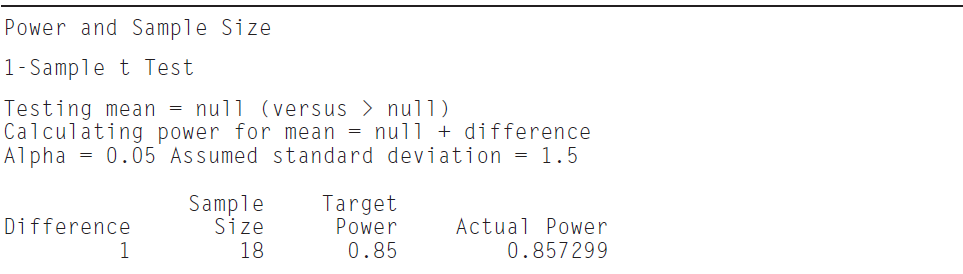
a. Is the power calculated for a one-tailed or two-tailed test?
b. Assume that the value of μ used for the null hypothesis is μ = 3. For what alternate value of μ is the power calculated?
c. If the sample size were 25, would the power be less than 0.85, greater than 0.85, or is it impossible to tell from the output? Explain.
d. If the difference were 0.5, would the power be less than 0.90, greater than 0.90, or is it impossible to tell from the output? Explain.
e. If the sample size were 17, would the power be less than 0.85, greater than 0.85, or is it impossible to tell from the output? Explain.
Fantastic news! We've Found the answer you've been seeking!
Step by Step Answer:
a Onetailed The alternate hypothesis is of the form 0 b 4 ...View the full answer

Answered By
Mredulraj Pandianchery
Hello,
I, Mredulraj Pandianchery has completed the graduation in B.E. Mechanical with CGPA-8.74. I am having 1+ years experience in mechanical background. I had secured 87.60% in 12th Science (Mathematics) and 92.40% in 10th standard. My good academic records and experience will help me to teach students effectively and help you to solve the doubts and problems.
0 Reviews
10+ Question Solved
Related Book For 
Question Posted:
