

A statistics teacher has given the following numbers of the traditional grades to her class of 105
Question:
A statistics teacher has given the following numbers of the traditional grades to her class of 105 students: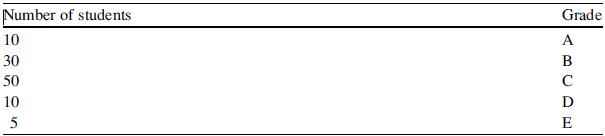
(a) Use a bar graph to show the distribution of grades.
(b) Use a pie chart to show the distribution of grades.
(c) Which of these graphs do you think is best for presenting the distribution of grades? Why?
Fantastic news! We've Found the answer you've been seeking!
Step by Step Answer:
In this case a bar graph is a better choice for presenting the distribution of grades for several re...View the full answer

Answered By
Asim farooq
I have done MS finance and expertise in the field of Accounting, finance, cost accounting, security analysis and portfolio management and management, MS office is at my fingertips, I want my client to take advantage of my practical knowledge. I have been mentoring my client on a freelancer website from last two years, Currently I am working in Telecom company as a financial analyst and before that working as an accountant with Pepsi for one year. I also join a nonprofit organization as a finance assistant to my job duties are making payment to client after tax calculation, I have started my professional career from teaching I was teaching to a master's level student for two years in the evening.
My Expert Service
Financial accounting, Financial management, Cost accounting, Human resource management, Business communication and report writing. Financial accounting : • Journal entries • Financial statements including balance sheet, Profit & Loss account, Cash flow statement • Adjustment entries • Ratio analysis • Accounting concepts • Single entry accounting • Double entry accounting • Bills of exchange • Bank reconciliation statements Cost accounting : • Budgeting • Job order costing • Process costing • Cost of goods sold Financial management : • Capital budgeting • Net Present Value (NPV) • Internal Rate of Return (IRR) • Payback period • Discounted cash flows • Financial analysis • Capital assets pricing model • Simple interest, Compound interest & annuities
65+ Reviews
86+ Question Solved
Related Book For 

Statistics For Business And Financial Economics
ISBN: 9781461458975
3rd Edition
Authors: Cheng Few Lee , John C Lee , Alice C Lee
Question Posted:
