

Using the data in Table 2.5, show the distribution of current assets for 1996 in a pie
Question:
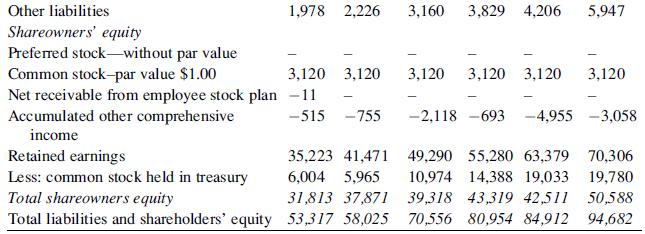
Using the data in Table 2.5, show the distribution of current assets for 1996 in a pie chart and a bar chart. Which of these graphs do you think is best for presenting the data?
Table 2.5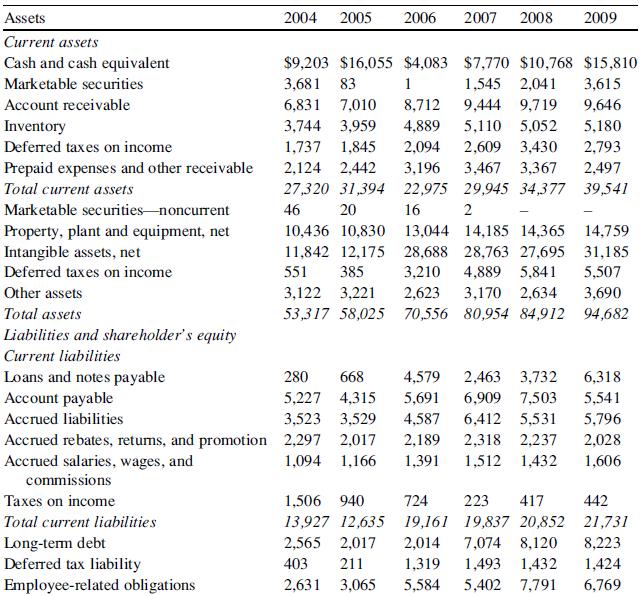
Fantastic news! We've Found the answer you've been seeking!
Step by Step Answer:

Answered By
Omar ELmoursi
I'm Omar, I have Bachelor degree in Business and Finance, My unique approach is to help students with questions and assignments, I can teach Business, Math, Accounting, Managerial Accounting, Economy, Human resources management, organizational behavior, project management, I have experience dealing with different types of students and teach them how to deal with different types of exercises.
4+ Reviews
10+ Question Solved
Related Book For 

Statistics For Business And Financial Economics
ISBN: 9781461458975
3rd Edition
Authors: Cheng Few Lee , John C Lee , Alice C Lee
Question Posted:
