

Consider the plot of power as a function of effect size for the two-sample t-test shown in
Question:
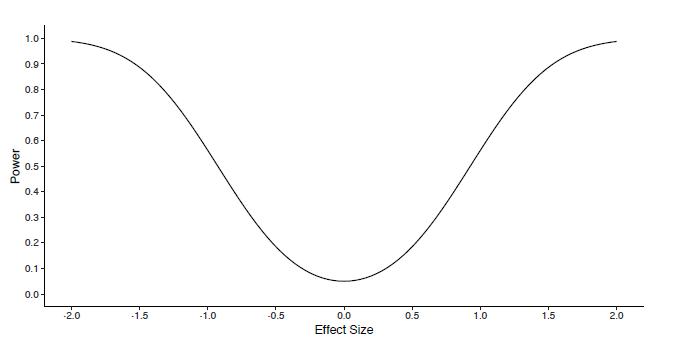
Consider the plot of power as a function of effect size for the two-sample t-test shown in Figure 4.3.
a. Create a plot to show power as a function of both effect size and sample size while keeping other parameters fixed.
b. The curve is shaped like an inverted bell curve, or a "bathtub" shape. Interpret the shape of the curve.
Data from Figure 4.3
Step by Step Answer:

This question has not been answered yet.
You can Ask your question!
Related Book For 
Design And Analysis Of Experiments And Observational Studies Using R
ISBN: 9780367456856
1st Edition
Authors: Nathan Taback
Question Posted:
