Draw the stem-and-leaf display of DPS of JNJ and Merck during the period 19882009 using Table 2.3,
Question:
Draw the stem-and-leaf display of DPS of JNJ and Merck during the period 1988–2009 using Table 2.3, in which data on EPS, DPS, and PPS for JNJ, Merck, and S&P 500 during the period 1988–2009 are given.
Table 2.3
Transcribed Image Text:
Johnson & Johnson EPS 5.63 3.19 3.38 4.30 1.54 2.71 3.08 3.65 2.12 Year DPS 1988 1.89 1989 1.10 1990 1.29 1991 1.51 1992 0.88 1993 1.00 1994 1.12 1995 1.25 1996 0.72 1997 0.83 1998 0.95 1999 1.04 2000 1.22 2001 0.66 2002 0.78 2003 0.91 2004 1.08 2005 1.26 2006 1.44 2007 1.60 2008 1.77 2009 1.91 2.41 2.23 2.94 3.39 1.83 2.16 2.39 2.83 3.46 3.73 3.63 4.57 4.40 PPS 85.13 59.38 71.75 114.50 50.50 44.88 54.75 85.50 49.75 65.88 83.88 93.25 105.06 59.10 53.71 51.66 63.42 60.10 66.02 66.70 59.83 64.41 Merck DPS 1.37 1.70 2.00 2.34 0.95 1.06 1.15 1.24 1.44 1.70 1.93 1.09 1.23 1.36 1.41 1.45 1.50 1.52 1.52 1.51 1.52 1.58 EPS 3.02 3.74 4.51 5.39 1.70 1.86 2.35 2.63 3.12 3.74 4.30 2.45 2.90 3.14 3.14 3.03 2.61 2.10 2.03 1.49 3.64 5.68 PPS 57.75 77.50 89.88 166.50 43.38 34.38 38.13 65.63 79.63 106.00 147.50 67.19 93.63 58.80 56.61 46.20 32.14 31.81 43.60 58.11 30.40 36.54 S&P500 265.79 322.84 334.59 376.18 415.74 451.41 460.42 541.72 670.5 873.43 1,085.5 1,327.33 1,427.22 1,194.18 993.94 965.23 1,130.65 1,207.23 1,310.46 1,477.19 1,220.04 948.05
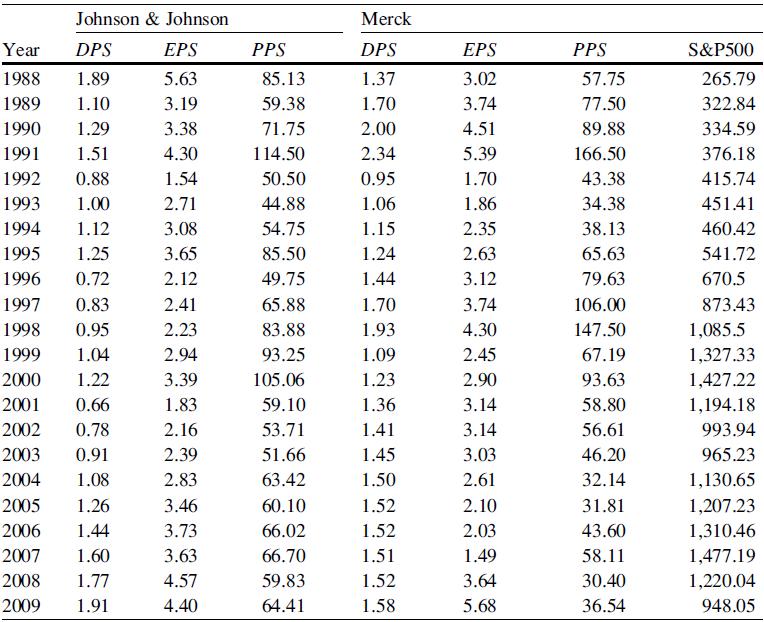
Fantastic news! We've Found the answer you've been seeking!
Step by Step Answer:
Answer rating: 100% (QA)
To create stemandleaf displays for the DPS Dividends Per Share of Johnson Johnson JNJ and Merck duri...View the full answer
Answered By
Utsab mitra
I have the expertise to deliver these subjects to college and higher-level students. The services would involve only solving assignments, homework help, and others.
I have experience in delivering these subjects for the last 6 years on a freelancing basis in different companies around the globe. I am CMA certified and CGMA UK. I have professional experience of 18 years in the industry involved in the manufacturing company and IT implementation experience of over 12 years.
I have delivered this help to students effortlessly, which is essential to give the students a good grade in their studies.
3.50+
2+ Reviews
10+ Question Solved
Related Book For
Statistics For Business And Financial Economics
ISBN: 9781461458975
3rd Edition
Authors: Cheng Few Lee , John C Lee , Alice C Lee
Question Posted:
Students also viewed these Business questions
-
Please calculate the mean, median for EPS, DPS, and PPS for JNJ during the period 19882009. Refer to Table 2.3, in which data on EPS, DPS, and PPS for JNJ, Merck, and S&P 500 during the period...
-
The accompanying stem and leaf plots were generated using MINITAB for the variables named "Popular Vote" and "Percent Vote." For Information: Refer to Exercises 1.51 and 1.52. Exercises 1.51 and 1.52...
-
The following table shows the number of customers who have visited a T Mobile retail store during the past 40 days. These data can also be found in the Excel file T Mobile. xlsx. a. Construct a stem...
-
In practice, bar charts are used occasionally to summarize a numerical variable over time, which can be handy. The bar chart below shows the inflation rate based on the Consumer Price Index in India....
-
You are considering the purchase of a business that produces net cash flows of a business that produces net cash flows of $350,000 per year in perpetuity. In a perfectly competitive market, what...
-
1. During March, Marc Grahams business performed services for a specific customer for which the fee was $10 000. Payment was received in the following April. (a) Was the revenue earned in March or...
-
Draw and determine the C.M. positions of the following molecules. Use a periodic table of the elements for the masses of the elements (it is enough to consider the mass number). Atomic distances are...
-
At the end of its first year, the trial balance of Boyer Company shows Equipment $22,000 and zero balances in Accumulated DepreciationEquipment and Depreciation Expense. Depreciation for the year is...
-
1. Letter of the word INDIANOIL are arranged in all possible ways. The number of permutations in which A, I, O occur only at odd places, is : (a) 720 2. (b) 360 (c) 240 (d) 120 How many different...
-
Construct a frequency, cumulative frequency, and relative frequency table for the priceearnings ratio (PER) of the JNJ company using class boundaries: -20.000 PER <0.000, 0.000 < PER <5.000, 5.000 <...
-
The following graph shows the Lorenz curves for two countries, Modestia and Richardonia. Which country has the most nearly equal distribution of income? Cumulative Percentage of Family Income...
-
In Problems below use the graph shown in the figure and identify points from A through I that satisfy the given conditions. 1. 0 (b) f'(x) <0 and f"(x) <0 (c) f'(x) = 0 and f"(x)> 0 (d) f'(x) >0 and...
-
What is a risk inherent in using the waterfall life-cycle model? Explain in details.
-
For each ordered pair, determine -6x+7y=2 7x-4y=6 a solution to the system of equations.
-
A project has an initial outlay of $ 2 , 6 6 7 . The project will generate cash flows of $ 7 4 2 in Years 1 - 7 . What is the Equivalent Annual Annuity ( EAA ) of this project? Assume an interest...
-
What is the likely reason that the parietal lobe is activated in brain scans while people are responding to moral dilemmas?
-
What is the Value of the R-Square? Using the below data set Select one: a. 0 b. 0.870 c. 0.889 d. 0.942 Table 2 Year Ln GDP Ln Labor Ln Capital 1958 9.7176 5.6186 9.7872 1959 9.7706 5.6146 9.8035...
-
Define IMC and discuss how marketers implement it.
-
We all experience emotions, but some people disguise their true feelings better than others. Do you think this is a helpful or harmful thing to do? Under what conditions do you think it would be most...
-
New, effective AIDS vaccines are now being developed using the process of "sieving" (i.e., sifting out infections with some strains of HIV). Harvard School of Public Health Statistician Peter Gilbert...
-
A random sample of 250 observations was classified according to the row and column categories shown in the table below. a. Do the data provide sufficient evidence to conclude that the rows and...
-
A random sample of 150 observations was classified into the categories shown in the table below. a. Do the data provide sufficient evidence that the categories are not equally likely? Use...
-
Propose and design a Project plan for implementation of AI software. the plan should define the folowinng project objectives organization objectives project scope project assumption project roles and...
-
Match the following CSBs Question 4 options: but you must still report this income until the bond matures or you cash it in. report the amount shown on the T5 slips. until you cash it in. 1. Interest...
-
Our reading (University of Phoenix, 2021) discussed 4 steps we can use when solving problems (a process that can also be used for making decisions): Identify, Investigate, Implement, and Evaluate...
Study smarter with the SolutionInn App