

Each year the National Oceanic and Atmospheric Association (NOAA) produces a report on the status of the
Question:
Each year the National Oceanic and Atmospheric Association (NOAA) produces a report on the status of the United States marine fisheries. Consider the table below from the latest report, summarizing the shellfish catch in three different regions.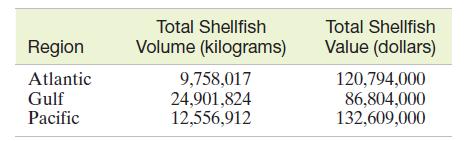
a. Use a pie chart to describe the shellfish catch by volume. (Assume each kilogram of shellfish catch volume is classified by region.)
b. Use a pie chart to describe the shellfish catch by value. (Assume each dollar of shellfish catch value is classified by region.)
c. Compare and contrast the two pie charts. What conclusions can you draw from the charts?
Fantastic news! We've Found the answer you've been seeking!
Step by Step Answer:
a The pie chart is shown below More than half by volume of the shellf...View the full answer

Answered By
Bhartendu Goyal
Professional, Experienced, and Expert tutor who will provide speedy and to-the-point solutions. I have been teaching students for 5 years now in different subjects and it's truly been one of the most rewarding experiences of my life. I have also done one-to-one tutoring with 100+ students and help them achieve great subject knowledge. I have expertise in computer subjects like C++, C, Java, and Python programming and other computer Science related fields. Many of my student's parents message me that your lessons improved their children's grades and this is the best only thing you want as a tea...
2+ Reviews
10+ Question Solved
Related Book For 

Statistics For Business And Economics
ISBN: 9780136855354
14th Edition
Authors: James T. McClave, P. George Benson, Terry T Sincich
Question Posted:
