

In Example 2.2 we analyzed 50 processing times (listed in Table 2.4) for the development of price
Question:
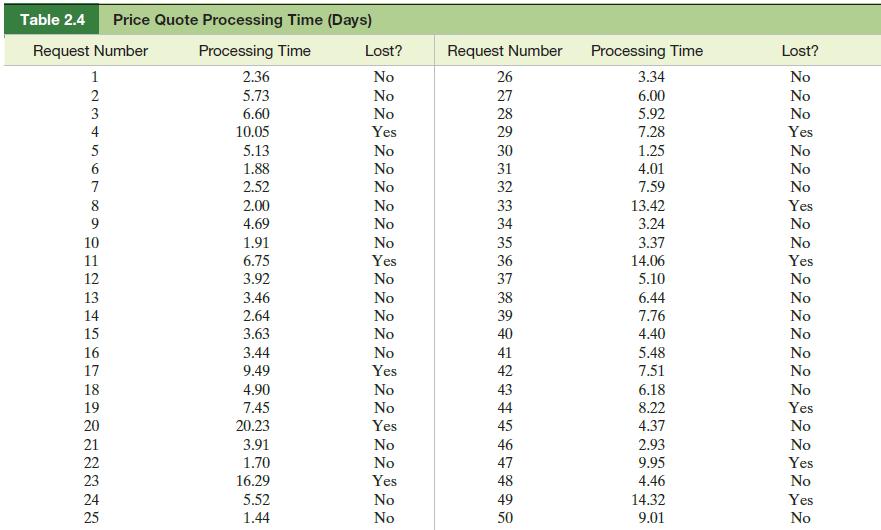
In Example 2.2 we analyzed 50 processing times (listed in Table 2.4) for the development of price quotes by the manufacturer of industrial wheels. The intent was to determine whether the success or failure in obtaining the order was related to the amount of time to process the price quotes. Each quote that corresponds to “lost” business was so classified. Use a statistical software package to draw a box plot for all 50 processing times. What does the box plot reveal about the data? Identify any outliers in the data set.
Data from example 2.2
A manufacturer of industrial wheels suspects that profitable orders are being lost because of the long time the firm takes to develop price quotes for potential customers. To investigate this possibility, 50 requests for price quotes were randomly selected from the set of all quotes made last year, and the processing time was determined for each quote. The processing times are displayed in Table 2.4, and each quote was classified according to whether the order was “lost” or not (i.e., whether or not the customer placed an order after receiving a price quote).
Data from Table 2.4
Step by Step Answer:
The Minitab box plot printout for these data is shown in Figure ...View the full answer


Statistics For Business And Economics
ISBN: 9781292227085
13th Global Edition
Authors: Terry Sincich James Mcclave, P. George Benson
