

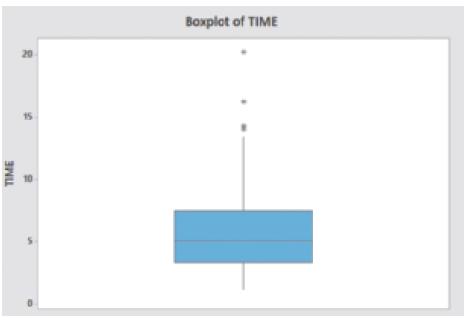
Refer to Example 2.16. The box plot for the 50 processing times (Figure 2.30) does not explicitly
Question:
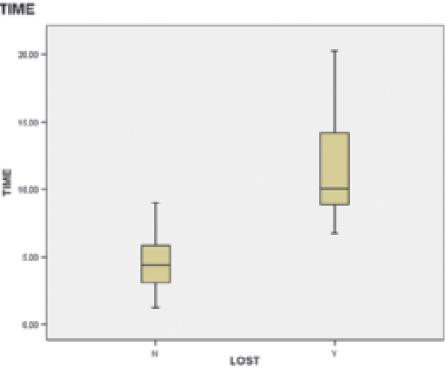
Refer to Example 2.16. The box plot for the 50 processing times (Figure 2.30) does not explicitly reveal the differences, if any, between the set of times corresponding to the success and the set of times corresponding to the failure to obtain the business. Box plots corresponding to the 39 “won” and 11 “lost” bids were generated using SPSS and are shown in Figure 2.31. Interpret them.
Data from example 2.16
In Example 2.2 we analyzed 50 processing times (listed in Table 2.4) for the development of price quotes by the manufacturer of industrial wheels. The intent was to determine whether the success or failure in obtaining the order was related to the amount of time to process the price quotes. Each quote that corresponds to “lost” business was so classified. Use a statistical software package to draw a box plot for all 50 processing times. What does the box plot reveal about the data? Identify any outliers in the data set.
Data from figure 2.30
Data from figure 2.31
Step by Step Answer:
The division of the data set into two parts corresponding to won and lost b...View the full answer


Statistics For Business And Economics
ISBN: 9781292227085
13th Global Edition
Authors: Terry Sincich James Mcclave, P. George Benson
