

Question: The 50 companies percentages of revenues spent on R&D are repeated in Table 2.6. We have previously shown (see Figure 2.21) that the mean and
The 50 companies’ percentages of revenues spent on R&D are repeated in Table 2.6. We have previously shown (see Figure 2.21) that the mean and standard deviation of these data (rounded) are 8.49 and 1.98, respectively. Calculate the fraction of these measurements that lie within the intervals x̄ ± s, x̄ ± 2s, and x̄ ± 3s and compare the results with those predicted by Rules 2.1 and 2.2. 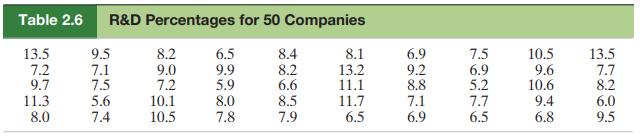
Data from figure 2.21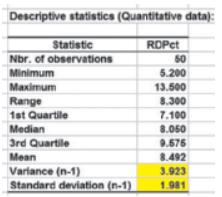
Table 2.6 R&D Percentages for 50 Companies 13.5 7.2 9.7 11.3 8.0 9.5 7.1 7.5 5.6 7.4 8.2 9.0 7.2 10.1 10.5 6.5 9.9 5.9 8.0 7.8 8.4 8.2 6.6 8.5 7.9 8.1 13.2 11.1 11.7 6.5 6.9 9.2 8.8 7.1 6.9 7.5 6.9 5.2 7.7 6.5 10.5 9.6 10.6 9.4 6.8 13.5 7.7 8.2 6.0 9.5
Step by Step Solution
3.44 Rating (147 Votes )
There are 3 Steps involved in it
We first form the interval A check of the measurements reveals ... View full answer

Get step-by-step solutions from verified subject matter experts