

The 50 companies percentages of revenues spent on R&D are repeated in Table 2.6. We have previously
Question:
The 50 companies’ percentages of revenues spent on R&D are repeated in Table 2.6. We have previously shown (see Figure 2.21) that the mean and standard deviation of these data (rounded) are 8.49 and 1.98, respectively. Calculate the fraction of these measurements that lie within the intervals x̄ ± s, x̄ ± 2s, and x̄ ± 3s and compare the results with those predicted by Rules 2.1 and 2.2. 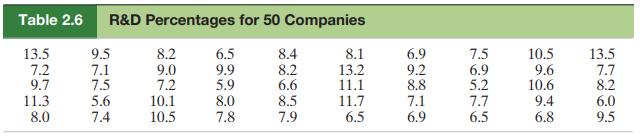
Data from figure 2.21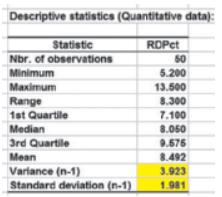
Fantastic news! We've Found the answer you've been seeking!
Step by Step Answer:
We first form the interval A check of the measurements reveals ...View the full answer

Answered By
GERALD KAMAU
non-plagiarism work, timely work and A++ work
6+ Reviews
11+ Question Solved
Related Book For 

Statistics For Business And Economics
ISBN: 9781292227085
13th Global Edition
Authors: Terry Sincich James Mcclave, P. George Benson
Question Posted:
