

The Home News used this bar chart (next column, bottom) on page Dl of its November 20,
Question:
The Home News used this bar chart (next column, bottom) on page Dl of its November 20, 1991, issue to depict the increasing popularity of turkey not just at holiday meals but throughout the year.
(a) How much turkey was consumed per person in1960–1990, respectively?
(b) How much has per person consumption of turkey increased from 1970 to 1990?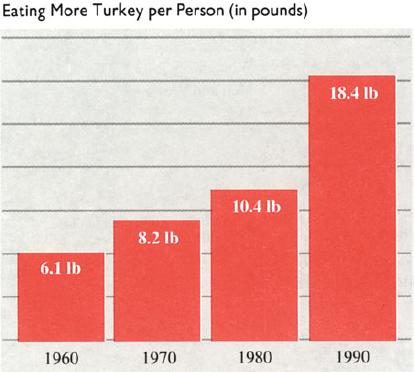
Fantastic news! We've Found the answer you've been seeking!
Step by Step Answer:
Based on the bar chart provided a The turkey consu...View the full answer

Answered By
Sidharth Jain
My name is Sidharth. I completed engineering from National Institute of Technology Durgapur which is one of the top college in India. I am currently working as an Maths Faculty in one of the biggest IITJEE institute in India. Due to my passion in teaching and Maths, I came to this field. I've been teaching for almost 3 years.
Apart from it I also worked as an Expert Answerer on Chegg.com. I have many clients from USA to whom I teach online and help them in their assignments. I worked on many online classes on mymathlab and webassign. I guarantee for grade 'A'.
3+ Reviews
10+ Question Solved
Related Book For 

Statistics For Business And Financial Economics
ISBN: 9781461458975
3rd Edition
Authors: Cheng Few Lee , John C Lee , Alice C Lee
Question Posted:
