Use MINITAB to draw histograms for both the sample means and the sample standard deviations, which have
Question:
Use MINITAB to draw histograms for both the sample means and the sample standard deviations, which have been calculated in question 85. Explain the results.
Question 85
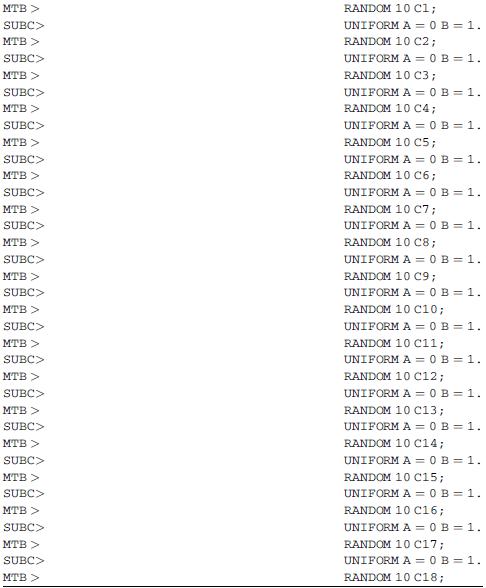
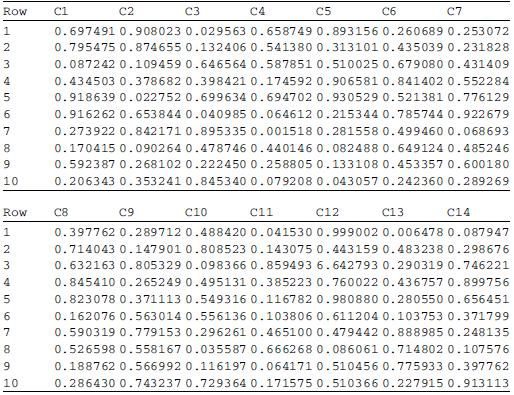
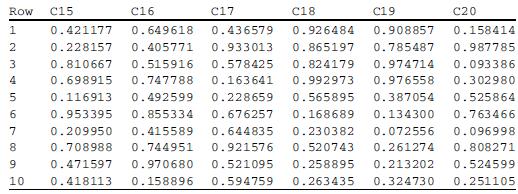
The MINITAB output in the figure is 20 random samples drawn from a uniform distribution between 0 and 1. Calculate the sample means and sample standard deviations by using the MINITAB program.


Transcribed Image Text:
MTB SUBC> MTB > SUBC> MTB > SUBC> MTB > SUBC> MTB > SUBC> MTB > SUBC> MTB > SUBC> MTB > SUBC> MTB > SUBC> MTB > SUBC> MTB > SUBC> MTB > SUBC> MTB > SUBC> MTB > SUBC> MTB > SUBC> MTB > SUBC> MTB > SUBC> MTB > RANDOM 10 C1; UNIFORM A = 0 B = 1. RANDOM 10 C2; UNIFORM A = 0 B = 1. RANDOM 10 C3; UNIFORM A = 0 B = 1. RANDOM 10 C4; UNIFORM A = 0 B = 1. RANDOM 10 C5; UNIFORM A = 0 B = 1. RANDOM 10 C6; UNIFORM A = 0 B = 1. RANDOM 10 C7; UNIFORM A = 0 B = 1. RANDOM 10 C8; UNIFORM A = 0 B = 1. RANDOM 10 C9; UNIFORM A = 0 B = 1. RANDOM 10 C10; UNIFORM A = 0 B = 1. RANDOM 10 C11; UNIFORM A = 0 B = 1. RANDOM 10 C12; UNIFORM A = 0 B = 1. RANDOM 10 C13; UNIFORM A = 0 B = 1. RANDOM 10 C14; UNIFORM A = 0 B = 1. RANDOM 10 C15; UNIFORM A = 0 B = 1. RANDOM 10 C16; UNIFORM A = 0 B = 1. RANDOM 10 C17; UNIFORM A = 0 B = 1. RANDOM 10 C18;
Step by Step Answer:

This question has not been answered yet.
You can Ask your question!
Related Book For 

Statistics For Business And Financial Economics
ISBN: 9781461458975
3rd Edition
Authors: Cheng Few Lee , John C Lee , Alice C Lee
Question Posted:
Students also viewed these Business questions
-
Use the results you got in question 85 to plot sample means against sample standard deviation. What is the probability of the range, the sample means between .45 and .55, and the sample standard...
-
The MINITAB output in the figure is 20 random samples drawn from a uniform distribution between 0 and 1. Calculate the sample means and sample standard deviations by using the MINITAB program. MTB...
-
1. Explain why both of the situations in Activity 8.1 and Activity 8.2 are observational experiments. What key elements of a designed experiment are missing in each situation? 2. A movie company...
-
Create a Stored Procedure: Stored procedures allow you to make changes to the database structure and manage performance without needing to rewrite applications or deploy application updates. In this...
-
The Dorben Foundry uses an overhead crane with a magnetic head to load scrap iron into their blast furnace. The crane operator uses various levers to control the three degrees of freedom needed for...
-
When is a vector product the zero vector? What is orthogonality?
-
Identify treatments and experimental units in the following scenarios. a. City A would like to evaluate whether a new employment training program for the unemployed is more effective compared to the...
-
Sabates Company set the following standard unit costs for its single product. Direct materials (5 Ibs. @ $10 per Ib.) . . . . . . . . . . . . . . . . . . . $ 50.00 Direct labor (3 hrs. @ $15 per hr.)...
-
Please help with questions Image transcription text 1. For each of the scale interval values given in step 3, calculate the voltage resolution based on the bit resolution and the range of voltage...
-
Suppose you draw two cards from a standard 52-card deck with replacement. Write out the sampling distribution for the suit drawn.
-
In a survey by the United Airlines of 100 flights between Jan. 2, 2012 to Feb. 15, 2012, whether the flights arrive their destination on time or not are recorded. What is the sample proportion?...
-
Compare Keynesian and supply-side economists' positions on the effects of reduction in the income tax rate?
-
Q1.Questions selected for conducting interview and the strong reasons - complete, comprehensive effective and strategic to gather primary date. Q2.Questionnaire Proofreading - clarity and...
-
Consider a processor with a two-level cache and the following characteristics: Parameter Base CPI (clock cycles per instruction), No Memory Stalls Processor Clock Frequency Main Memory Access Time...
-
What would an Architecture Diagram look like for the Virgin Velocity App, Customer process?
-
(+5) Determine the output Q, in terms of the inputs A B, by filling in the table below (the Q column should only consist of a 1 or 0 + A+ 0 04 1+ 1+ A .8- B 0+ 14 0+ 1+ Qu P ts t t t P P P 2 -.0
-
1. Find (as simple as possible) an unambiguous regular grammar which generates the following language over A = {a,b}: L = {x | num(a, x) is even A each b is followed by at least one a} where num(a,x)...
-
What is the importance of feedback in the communications process? Of noise?
-
What is your assessment of the negotiations process, given what you have studied? What are your recommendations for Mr. Reed? You must justify your conclusions
-
For each of the following items considered independently, indicate whether the circumstances call for an addition modification (A), a subtraction modification (S), or no modification (N) in computing...
-
Perk Corporation is subject to tax only in State A. Perk generated the following income and deductions. Federal taxable income .............. $300,000 State A income tax expense ............. 15,000...
-
In no more than three PowerPoint slides, list some general guidelines that a taxpayer can use to determine whether it has an obligation to file an income tax return with a particular state. (Include...
-
Cove's Cakes is a local bakery. Price and cost information follows: Price per cake Variable cost per cake Ingredients $ 13.01 2.25 Direct labor 1.10 Overhead (box, etc.) 0.28 Fixed costs per month...
-
S Campbell Company is considering investing in two new vans that are expected to generate combined cash inflows of $30,000 per year. The vans' combined purchase price is $96,500. The expected life...
-
Janice Huffman has decided to start Jordan Cleaning, residential housecleaning service company. She is able to rent cleaning equipment at a cost of $780 per month. Labor costs are expected to be $60...

Study smarter with the SolutionInn App


