

The Centers for Disease Control and Prevention (CDC) provided Table 2-11 and Figure 2-12 showing mortality rate
Question:
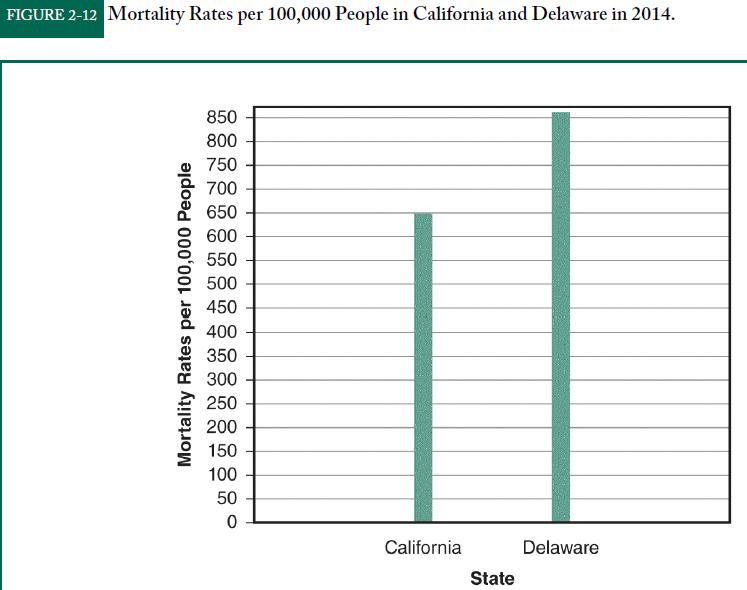
The Centers for Disease Control and Prevention (CDC) provided Table 2-11 and Figure 2-12 showing mortality rate data from Delaware and California in 2014.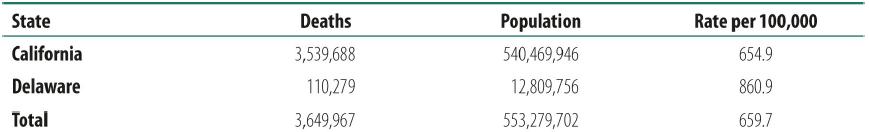
Reproduced from Centers for Disease Control and Prevention, National Center for Health Statistics. Compressed Mortality File 1999-2013. Archive on CDC WONDER Online Database, released October 2014. Data are from the Compressed Mortality File 1999-2013 Series 20 No. 2S, 2014, as compiled from data provided by the 57 vital statistics jurisdictions through the Vital Statistics Cooperative Program. Accessed at http://wonder.cdc.gov/cmf-icd10-archive2013.html on Apr 4, 2017.
Your colleague has a pending job offer and decides he will accept the offer in Delaware because too many people die in California every year. Do you agree with his decision? Why or why not?
Step by Step Answer:


Statistics For Nursing A Practical Approach
ISBN: 9781284142013
3rd Edition
Authors: Elizabeth Heavey
