

Draw an interaction plot for the data from Example 3. By-Hand Approach Follow Steps 1 and 2.
Question:
Draw an interaction plot for the data from Example 3.
By-Hand Approach Follow Steps 1 and 2.
Technology Approach Use Minitab or StatCrunch to draw the interaction plot. The steps to follow are given in the Technology Step-by-Step.
Data from Example 3
We presented data for an experimental drug that was meant to increase HDL cholesterol. The data are represented in Table 13 for convenience.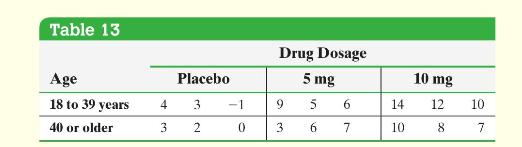
HDL cholesterol levels are known to have a distribution that is approximately normal. Verify that the largest sample standard deviation of any cell is no more than twice the smallest sample standard deviation of any cell.
Use Minitab to test whether there is an interaction effect between the drug dosage and age.
If the null hypothesis of no interaction is not rejected, determine whether there is sufficient evidence to conclude that the mean increase in HDL cholesterol is different (i) among each drug dosage group, (ii) for each age group.
Step by Step Answer:
By Hand Step 1 Table 14 shows the mean value of the response variable for ...View the full answer


Statistics Informed Decisions Using Data
ISBN: 9781292157115
5th Global Edition
Authors: Michael Sullivan
