

The data in Table 5 represent the birth weights (in pounds) of 50 randomly sampled babies. (a)
Question:
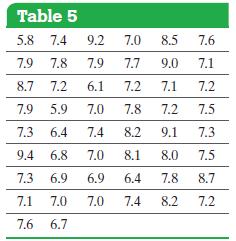
The data in Table 5 represent the birth weights (in pounds) of 50 randomly sampled babies.
(a) Find the mean and the median birth weight.
(b) Describe the shape of the distribution.
(c) Which measure of central tendency better describes the average birth weight?
Approach
(a) This can be done either by hand or technology. We will use a TI-84 Plus C.
(b) Draw a histogram to identify the shape of the distribution.
(c) If the data are roughly symmetric, the mean is the better measure of central tendency. If the data are skewed, the median is the better measure.
Fantastic news! We've Found the answer you've been seeking!
Step by Step Answer:

Answered By
Danish Sohail
My objective is to become most reliable expert for clients. For last 10 years I have been associated with the field of accounting and finance. My aim is to strive for best results and pay particular attention to client needs. I am always enthusiastic to help clients for issues and concerns related to business studies. I can work on analysis of the financial statements, calculate different ratios and analysis of ratios. I can critically evaluate stock prices based on the financial analysis and valuation for companies using financial statements of the business entity being valued with use of excel tools. I have expertise to provide effective and reliable help for projects in corporate finance, equity investments, financial accounting, cost accounting, financial planning, business plans, marketing plans, performance measurement, budgeting, economic research, risk assessment, risk management, derivatives, fixed income investments, taxation, auditing, and financial performance analysis.
78+ Reviews
112+ Question Solved
Related Book For 

Statistics Informed Decisions Using Data
ISBN: 9781292157115
5th Global Edition
Authors: Michael Sullivan
Question Posted:
