

Voting Pattern The following data represent the proportion of Americans who voted in the 2012 presidential election
Question:
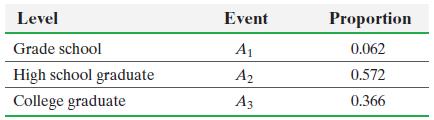
Voting Pattern The following data represent the proportion of Americans who voted in the 2012 presidential election at various levels of educational attainment.
If we let D represent the event that a randomly selected American who voted in the 2012 presidential election voted Democratic, we can also obtain the following probabilities:

(a) What is the probability that a randomly selected American who voted in the 2012 presidential election voted Democratic?
(b) What is the probability that an American who voted Democratic has graduated from college?
(c) What is the probability that an American who voted Democratic has a grade school education?
Fantastic news! We've Found the answer you've been seeking!
Step by Step Answer:

Answered By
Seema kuldeep
although I don't have an experience of teaching in a particular institute, previously I was an expert on Chegg and I have used to teach my batch mates and also my juniors.
1+ Reviews
10+ Question Solved
Related Book For 

Statistics Informed Decisions Using Data
ISBN: 9781292157115
5th Global Edition
Authors: Michael Sullivan
Question Posted:
