

The following relative frequency ogive represents the SAT math scores of college-bound students. (a) What is the
Question:
The following relative frequency ogive represents the SAT math scores of college-bound students.
(a) What is the class width? How many classes are represented in the graph?
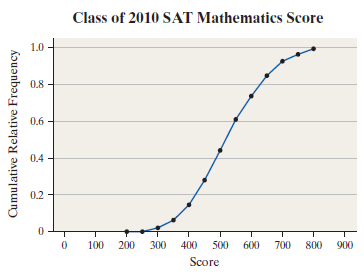
(b) What are the lower and upper limits of the first class?
(c) What are the lower and upper limits of the last class?
(d) Estimate the percentage of students who had a math score of 450 or below.
(e) Estimate the percentage of students who had a math score above 500.
(f) In which class did the most students fall?
Fantastic news! We've Found the answer you've been seeking!
Step by Step Answer:
a 50 The class width is the difference between successive class upper limits eg 300 25...View the full answer

Answered By
David Muchemi
I am a professional academic writer with considerable experience in writing business and economic related papers. I have been writing for my clients who reach out to me personally after being recommended to me by satisfied clients.
I have the English language prowess, no grammatical and spelling errors can be found in my work. I double-check for such mistakes before submitting my papers.
I deliver finished work within the stipulated time and without fail. I am a good researcher on any topic especially those perceived to be tough.
I am ready to work on your papers and ensure you receive the highest quality you are looking for. Please hire me to offer my readily available quality service.
Best regards,
27+ Reviews
61+ Question Solved
Related Book For 
Statistics Informed Decisions Using Data
ISBN: 9780321757272
4th Edition
Authors: Michael Sullivan III
Question Posted:
