

The following time-series graph shows the annual U.S. motor vehicle production from 1990 through 2008. (a) Estimate
Question:
The following time-series graph shows the annual U.S. motor vehicle production from 1990 through 2008.
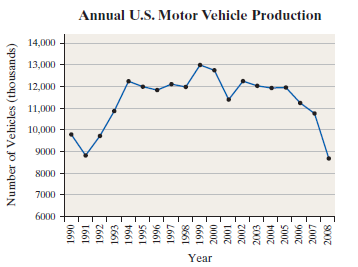
(a) Estimate the number of motor vehicles produced in the United States in 1991.
(b) Estimate the number of motor vehicles produced in the United States in 1999.
(c) Use your results from (a) and (b) to estimate the percent increase in the number of motor vehicles produced from 1991 to 1999.
(d) Estimate the percent decrease in the number of vehicles produced from 1999 to 2008.
Fantastic news! We've Found the answer you've been seeking!
Step by Step Answer:
a About 88 million motor vehicles were produced in the United States ...View the full answer

Answered By
GERALD KAMAU
non-plagiarism work, timely work and A++ work
6+ Reviews
11+ Question Solved
Related Book For 

Statistics Informed Decisions Using Data
ISBN: 9780321757272
4th Edition
Authors: Michael Sullivan III
Question Posted:
