

Exercise 10.31 considered the following data on the number of hours students spent on social network sites
Question:
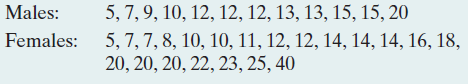 Enter the observations (separated by spaces) into the Permutation Test web app. Let males be Group 1 and females be Group 2. We are interested in testing whether the population mean number of hours spent on social networks differs between males and females, using as test statistic the difference in sample means.
a. What are the observed group means and their difference? (The subtitle of the dot plot shows this information.)
b. Press the Generate Random Permutation(s) button once to generate one permutation of the original data. What are the two group means and their difference under this permutation? (The subtitle of the dot plot shows this information.)
c. Did this one permutation lead to a difference that is less extreme, as extreme, or more extreme than the observed difference?
d. Select to generate 10,000 random permutations. How many of them resulted in a test statistic as or more extreme than the observed difference? (Remember, the alternative hypothesis is Ha: μ1 ˆ™ μ2)
e. Find and interpret the permutation P-value.
Fantastic news! We've Found the answer you've been seeking!
Step by Step Answer:
a From the app x 1 119 x 2 156 and x 1 x 2 37 b One permutation yield...View the full answer

Answered By
Somshukla Chakraborty
I have a teaching experience of more than 4 years by now in diverse subjects like History,Geography,Political Science,Sociology,Business Enterprise,Economics,Environmental Management etc.I teach students from classes 9-12 and undergraduate students.I boards I handle are IB,IGCSE, state boards,ICSE, CBSE.I am passionate about teaching.Full satisfaction of the students is my main goal.
I have completed my graduation and master's in history from Jadavpur University Kolkata,India in 2012 and I have completed my B.Ed from the same University in 2013. I have taught in a reputed school of Kolkata (subjects-History,Geography,Civics,Political Science) from 2014-2016.I worked as a guest lecturer of history in a college of Kolkata for 2 years teaching students of 1st ,2nd and 3rd year. I taught Ancient and Modern Indian history there.I have taught in another school in Mohali,Punjab teaching students from classes 9-12.Presently I am working as an online tutor with concept tutors,Bangalore,India(Carve Niche Pvt.Ltd.) for the last 1year and also have been appointed as an online history tutor by Course Hero(California,U.S) and Vidyalai.com(Chennai,India).
2+ Reviews
10+ Question Solved
Related Book For 

Statistics The Art And Science Of Learning From Data
ISBN: 9780321997838
4th Edition
Authors: Alan Agresti, Christine A. Franklin, Bernhard Klingenberg
Question Posted:
