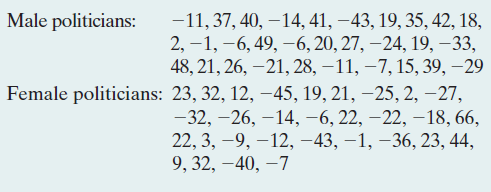
For a rating experiment, researchers translated short video clips of randomly selected speeches by 30 male and
Question:

a. State the null and alternative hypothesis and run a permutation test (e.g., using the web app) to see whether there is a difference in the ratings on competence between female and male speakers. What is the conclusion when the significance level is 0.05?
b. Run a t test. Are results comparable to the ones from the permutation test? Why or why not?
Fantastic news! We've Found the answer you've been seeking!
Step by Step Answer:
Related Book For 

Statistics The Art And Science Of Learning From Data
ISBN: 9780321997838
4th Edition
Authors: Alan Agresti, Christine A. Franklin, Bernhard Klingenberg
Question Posted:


