

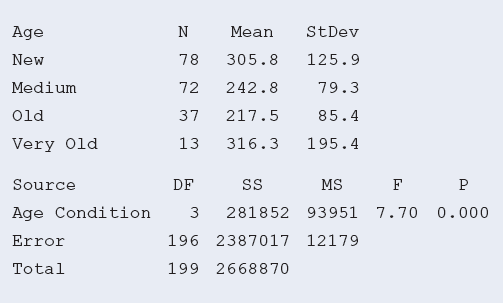
For the House Selling Prices OR data file on the books website, the output shows the result
Question:
a. Using information given in the tables, show how to construct a 95% confidence interval comparing the population means of new and medium-aged houses.
b. Interpret the confidence interval.
Fantastic news! We've Found the answer you've been seeking!
Step by Step Answer:
a The 95 CI is b Because 0 does not fall in this co...View the full answer

Answered By
Charles mwangi
I am a postgraduate in chemistry (Industrial chemistry with management),with writing experience for more than 3 years.I have specialized in content development,questions,term papers and assignments.Majoring in chemistry,information science,management,human resource management,accounting,business law,marketing,psychology,excl expert ,education and engineering.I have tutored in other different platforms where my DNA includes three key aspects i.e,quality papers,timely and free from any academic malpractices.I frequently engage clients in each and every step to ensure quality service delivery.This is to ensure sustainability of the tutoring aspects as well as the credibility of the platform.
2+ Reviews
10+ Question Solved
Related Book For 

Statistics The Art And Science Of Learning From Data
ISBN: 9780321997838
4th Edition
Authors: Alan Agresti, Christine A. Franklin, Bernhard Klingenberg
Question Posted:
