

In Data 4.6 we look at finger-tapping rates to see if ingesting caffeine increases average tap rate.
Question:
Table 4.4

(a) Create one randomization sample by randomly separating the 20 data values into two groups. (One way to do this is to write the 20 tap rate values on index cards, shuffle, and deal them into two groups of 10.)
(b) Find the sample mean of each group and calculate the difference, xÌ…c ˆ’ xÌ…n, in the simulated sample means.
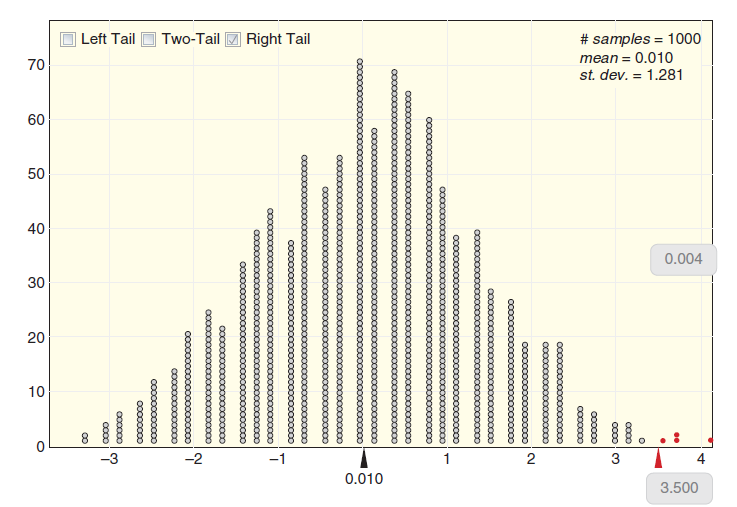
(c) The difference in sample means found in part (b) is one data point in a randomization distribution. Make a rough sketch of the randomization distribution shown in Figure 4.11 on page 242 and locate your randomization statistic on the sketch.
Data 4.6
Many people feel they need a cup of coffee or other source of caffeine to €˜€˜get going€ in the morning. The effects of caffeine on the body have been extensively studied. In one experiment,14 researchers trained a sample of male college students to tap their fingers at a rapid rate. The sample was then divided at random into two groups of 10 students each. Each student drank the equivalent of about two cups of coffee, which included about 200 mg of caffeine for the students in one group but was decaffeinated coffee for the second group. After a 2-hour period, each student was tested to measure finger tapping rate (taps per minute). The students did not know whether or not their drinks included caffeine and the person measuring the tap rates was also unaware of the groups. This was a double-blind experiment with only the statistician analyzing the data having information linking the group membership to the observed tap rates. (Think back to Chapter 1: Why is this important?) The goal of the experiment was to determine whether caffeine produces an increase in the average tap rate. The finger-tapping rates measured in this experiment are summarized in Table 4.4 and stored in CaffeineTaps.
Figure 4.11
The word "distribution" has several meanings in the financial world, most of them pertaining to the payment of assets from a fund, account, or individual security to an investor or beneficiary. Retirement account distributions are among the most...
Step by Step Answer:
a For example one possible randomization sample is shown below b For the ran...View the full answer


Statistics Unlocking The Power Of Data
ISBN: 9780470601877
1st Edition
Authors: Robin H. Lock, Patti Frazer Lock, Kari Lock Morgan, Eric F. Lock, Dennis F. Lock
