

In Exercise 2.205, we used a random sample of 10 countries to use the size of a
Question:
(a) Use technology to find the new regression line using the 11 data points.
(b) The slope of the regression line using the original 10 points in Exercise 2.205 is about 0.08. Compare the slope with US added to the slope without US. Does adding US have a strong effect on the slope? Why or why not?
(c) Predict the percent rural for US with the new regression line. Is this prediction better than the prediction given in Example 2.205 (which was 752%)?
Exercise 2.205
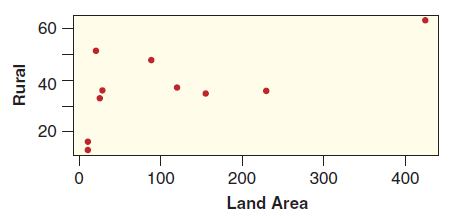
Two variables in the dataset AllCountries are the size of the country (in 1000 sq km) and the percent of the population living in rural areas. We are interested in using the size of the country (LandArea) to predict the percent rural (Rural). The values of these variables for a random sample of ten countries is shown, with the 3-letter country codes, in Table 2.37, and is also available in TenCountries. Figure 2.74 shows a scatterplot of the data.
Table 2.37

Figure 2.74
Step by Step Answer:
a Using technology the regression line is b The slope with the USA is 0002 the slope without i...View the full answer


Statistics Unlocking The Power Of Data
ISBN: 9780470601877
1st Edition
Authors: Robin H. Lock, Patti Frazer Lock, Kari Lock Morgan, Eric F. Lock, Dennis F. Lock
