

The 2014 GSS asked about the number of hours you watch TV per day. An analysis that
Question:
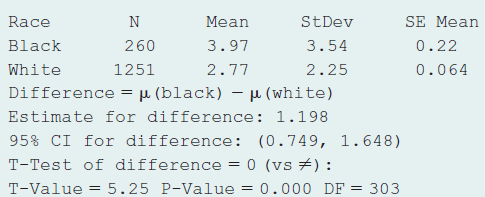
a. Do you believe that TV watching has a normal distribution for each race? Why or why not? What effect does this have on inference comparing population means?
b. Explain how to interpret the reported confidence interval. Can you conclude that one population mean is higher? If so, which one? Explain.
c. On what assumptions is this inference based?
The word "distribution" has several meanings in the financial world, most of them pertaining to the payment of assets from a fund, account, or individual security to an investor or beneficiary. Retirement account distributions are among the most...
Fantastic news! We've Found the answer you've been seeking!
Step by Step Answer:
a TV distribution does not likely have a normal distribution for either race because the standard de...View the full answer

Answered By
AJIN KURIAKOSE
I HAVE ELECTRONICS ENGINEERING DEGREE..AND MY AREA OF INTEREST IS MATHEMATICS,CONTROL SYSTEM,NETWORK,DIGITAL
21+ Reviews
32+ Question Solved
Related Book For 

Statistics The Art And Science Of Learning From Data
ISBN: 9780321997838
4th Edition
Authors: Alan Agresti, Christine A. Franklin, Bernhard Klingenberg
Question Posted:
