

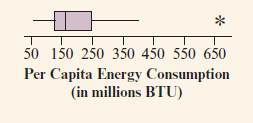
The Energy Information Administration records per capita consumption of energy by country. The box plot below shows
Question:
a. Use the box plot to give approximate values for the five-number summary of energy consumption.
b. Italy had a per capita consumption of 139 million BTU. How many standard deviations from the mean was its consumption?
c. The United States was not included in the data, but its per capita consumption was 334 million BTU. Relative to the distribution for the included OECD nations, the United States is how many standard deviations from the mean?
The word "distribution" has several meanings in the financial world, most of them pertaining to the payment of assets from a fund, account, or individual security to an investor or beneficiary. Retirement account distributions are among the most...
Fantastic news! We've Found the answer you've been seeking!
Step by Step Answer:
a Numbers are approximate Minimum 50 Q1 130 Median 160 Q3 250 Maximum 6...View the full answer

Answered By
Nazrin Ziad
I am a post graduate in Zoology with specialization in Entomology.I also have a Bachelor degree in Education.I posess more than 10 years of teaching as well as tutoring experience.I have done a project on histopathological analysis on alcohol treated liver of Albino Mice.
I can deal with every field under Biology from basic to advanced level.I can also guide you for your project works related to biological subjects other than tutoring.You can also seek my help for cracking competitive exams with biology as one of the subjects.
2+ Reviews
10+ Question Solved
Related Book For 

Statistics The Art And Science Of Learning From Data
ISBN: 9780321997838
4th Edition
Authors: Alan Agresti, Christine A. Franklin, Bernhard Klingenberg
Question Posted:
