

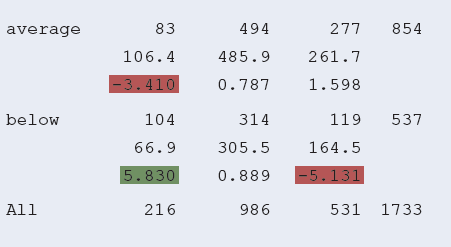
The table displays the observed and expected cell counts and the standardized residuals for testing independence of
Question:
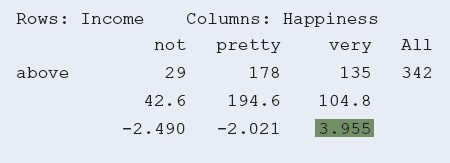
a. How would you interpret the standardized residual of -2.49?
b. Interpret the standardized residuals highlighted in green.
c. Interpret the standardized residuals highlighted in red.
Fantastic news! We've Found the answer you've been seeking!
Step by Step Answer:
a The standardized residual indicates the number of standard errors that the observed count falls fr...View the full answer

Answered By
Tamondong Riza
Professionally, I am a teacher with years of experience tutoring math and science, as well as teaching in both public schools and independent schools. I feel that education should be an enlightening experience for all children, and I'm committed to helping my students learn new skills and make progress in their subjects.
0 Reviews
10+ Question Solved
Related Book For 

Statistics The Art And Science Of Learning From Data
ISBN: 9780321997838
4th Edition
Authors: Alan Agresti, Christine A. Franklin, Bernhard Klingenberg
Question Posted:
