

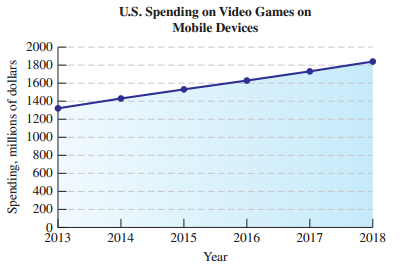
The graph below shows the amount of money spent in the United States on video games played
Question:
(a) Assuming this trend continues, use the graph to predict the amount spent in the United States on video games played on mobile devices in 2020.
(b) Explain how you are using inductive reasoning to determine your answer.
Fantastic news! We've Found the answer you've been seeking!
Step by Step Answer:
a 2050 million b ...View the full answer

Answered By
Jehal Shah
I believe everyone should try to be strong at logic and have good reading habit. Because If you possess these two skills, no matter what difficult situation is, you will definitely find a perfect solution out of it. While logical ability gives you to understand complex problems and concepts quite easily, reading habit gives you an open mind and holistic approach to see much bigger picture.
So guys, I always try to explain any concept keeping these two points in my mind. So that you will never forget any more importantly get bored.
Last but not the least, I am finance enthusiast. Big fan of Warren buffet for long term focus investing approach. On the same side derivatives is the segment I possess expertise.
If you have any finacne related doubt, do reach me out.
1+ Reviews
10+ Question Solved
Related Book For 

A Survey of Mathematics with Applications
ISBN: 978-0134112107
10th edition
Authors: Allen R. Angel, Christine D. Abbott, Dennis Runde
Question Posted:
