

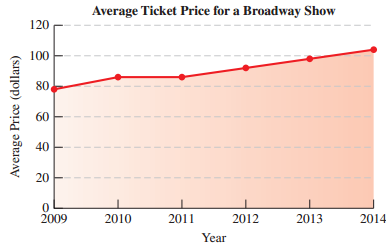
The graph below shows the average ticket price for a show on Broadway for each season from
Question:
(a) Assuming this trend continues, use the graph to predict the average ticket price for a show on Broadway for the 2015 season.
(b) Explain how you are using inductive reasoning to deter-mine your answer.
Fantastic news! We've Found the answer you've been seeking!
Step by Step Answer:
a 110 b We are ...View the full answer

Answered By
Nazrin Ziad
I am a post graduate in Zoology with specialization in Entomology.I also have a Bachelor degree in Education.I posess more than 10 years of teaching as well as tutoring experience.I have done a project on histopathological analysis on alcohol treated liver of Albino Mice.
I can deal with every field under Biology from basic to advanced level.I can also guide you for your project works related to biological subjects other than tutoring.You can also seek my help for cracking competitive exams with biology as one of the subjects.
2+ Reviews
10+ Question Solved
Related Book For 

A Survey of Mathematics with Applications
ISBN: 978-0134112107
10th edition
Authors: Allen R. Angel, Christine D. Abbott, Dennis Runde
Question Posted:
