

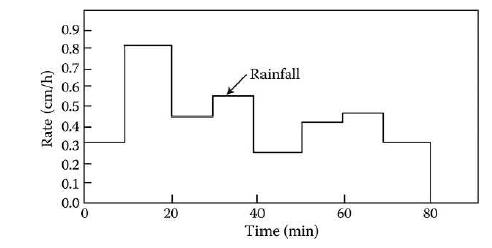
The rainfall hyetograph is shown in Figure 2 .20 and is listed in Table 2 .12. It
Question:
The rainfall hyetograph is shown in Figure 2 .20 and is listed in Table 2 .12. It is subject to a depression storage loss of 0 .15 cm and Horton infiltration with parameters f 0 =
0 .45 cm/h, fc = 0 .05 cm/h, and k = 1 h. Calculate the hyetograph of excess rainfall.
Table 2 .12
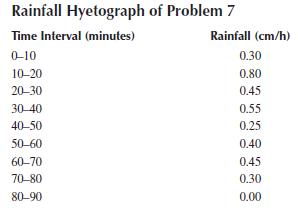
Figure 2 .20
Fantastic news! We've Found the answer you've been seeking!
Step by Step Answer:

Answered By
Junaid ahmed
I am an English language professor with years of experience In Teaching English Language and Literature. I like to help people in the various difficult matter.
2+ Reviews
10+ Question Solved
Related Book For 

Water Systems Analysis Design, And Planning Urban Infrastructure
ISBN: 9780367528454
1st Edition
Authors: Mohammad Karamouz
Question Posted:
