

In a catchment area in northern England, the measurements of evaporation (mm) shown in the Table 2
Question:
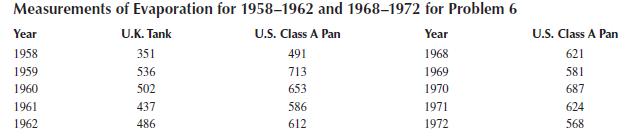
In a catchment area in northern England, the measurements of evaporation (mm) shown in the Table 2 .11 were made for 195 8–1962 and 196 8–1972. For the years 196 8–1972, measurements from the US Class A pan only were available. Estimate the volume of water lost each year in the later period from a reservoir of surface area of 1 .4 km 2 .
Table 2 .11
Fantastic news! We've Found the answer you've been seeking!
Step by Step Answer:

Answered By
William Otieno
I am a professional tutor and a writer with excellent skills that are important in serving the bloggers and other specialties that requires a great writer. The important aspects of being the best are that I have served so many clients with excellence
With excellent skills, I have acquired very many recommendations which have made it possible for me to survive as an excellent and cherished writer. Being an excellent content writer am also a reputable IT writer with essential skills that can make one turn papers into excellent result.
83+ Reviews
354+ Question Solved
Related Book For 

Water Systems Analysis Design, And Planning Urban Infrastructure
ISBN: 9780367528454
1st Edition
Authors: Mohammad Karamouz
Question Posted:
