

A Figure 10.62 shows the root locus of a unity negative feedback control system, where (K) is
Question:
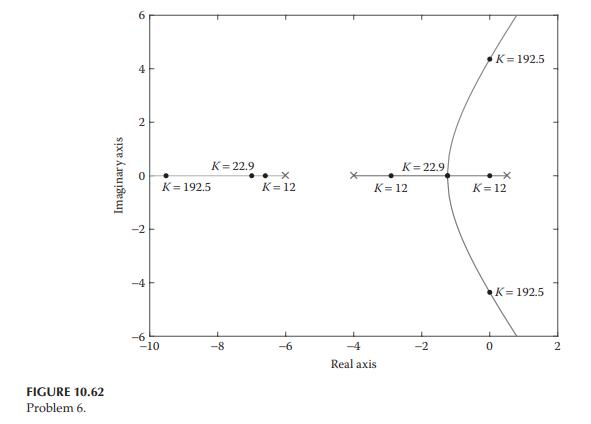
A Figure 10.62 shows the root locus of a unity negative feedback control system, where \(K\) is the proportional control gain.
a. Determine the transfer function of the plant. Use MATLAB to plot the root locus based on your choice of the plant, compare it with the root locus shown in Figure 10.62, and check the accuracy of your plant transfer function.
b. Find the range of values of \(K\) for which the system has damped oscillatory response. What is the value of \(K\) when pure harmonic oscillations occur? Also, what is the frequency of pure harmonic oscillations? Use MATLAB to plot the corresponding unit-step response and verify the accuracy of your computed frequency.
Step by Step Answer:

This question has not been answered yet.
You can Ask your question!


Modeling And Analysis Of Dynamic Systems
ISBN: 9781138726420
3rd Edition
Authors: Ramin S. Esfandiari, Bei Lu
