

Draw the Bewley lattice diagram for Problem 13.5, and plot (v(l / 3, t)) versus time (t)
Question:
Draw the Bewley lattice diagram for Problem 13.5, and plot \(v(l / 3, t)\) versus time \(t\) for \(0 \leqslant t \leqslant 5 \tau\). Also plot \(v(x, 3 \tau)\) versus \(x\) for \(0 \leqslant x \leqslant l\).
Data From Problem 13.5:-
Rework Example 13.4 with \(\mathrm{Z}_{\mathrm{R}}=4 \mathrm{Z}_{c}\) and \(\mathrm{Z}_{\mathrm{G}}=\mathrm{Z}_{c} / 3\).
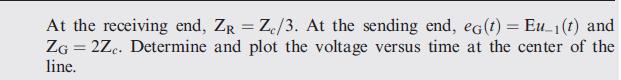
Data From Example 13.4:-
Step by Step Answer:

This question has not been answered yet.
You can Ask your question!
Related Book For 

Power System Analysis And Design
ISBN: 9781111425777
5th Edition
Authors: J Duncan Glover, Mulukutla S Sarma, Thomas Overbye
Question Posted:
