

For the control system shown in Fig. 3. 16: (a) plot the root loci of the system
Question:
For the control system shown in Fig. 3. 16:
(a) plot the root loci of the system
(b) find the value of gain $K$ such that the damping ratio $\xi$ of the dominant closed-loop poles is 0. 5
(c) obtain all the closed-loop poles using MATLAB
(d) plot the unit-step response curve using MATLAB.
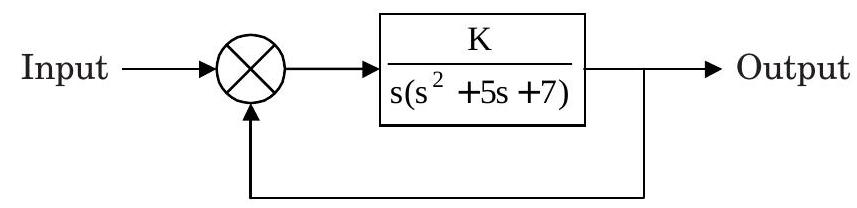
Fig. P 3. 16
Step by Step Answer:

This question has not been answered yet.
You can Ask your question!
Related Book For 

Analysis And Design Of Control System Using MATLAB
ISBN: 9788122424096
2nd Edition
Authors: R.V. Dukkipati
Question Posted:
