

The following figure shows the speed control system of an assembly plant (Figure 5.15). (a) Determine and
Question:
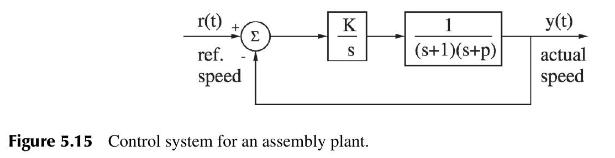
The following figure shows the speed control system of an assembly plant (Figure 5.15).
(a) Determine and plot the range of \(K\) and \(p\) that permits stable operation.
(b) In the assembly plant, if \(p=2\), sketch the root locus of the system as \(K\) varies from 0 to \(\infty\).
Fantastic news! We've Found the answer you've been seeking!
Step by Step Answer:
a The transfer function for the system is given by TsfracKs3p1 ...View the full answer

Answered By
John Aketch
I am a dedicated person with high degree of professionalism, particularly in academic writing. My desire is to is to make students excel in their academic endeavor.
3+ Reviews
10+ Question Solved
Related Book For 
Design And Analysis Of Control Systems Driving The Fourth Industrial Revolution
ISBN: 9781032718804
2nd Edition
Authors: Arthur G O Mutambara
Question Posted:
