

The unit-step response of a plant is shown in Figure 10.46. a. The lag time (L) and
Question:
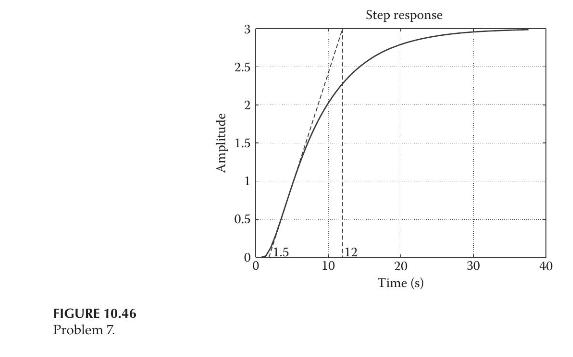
The unit-step response of a plant is shown in Figure 10.46.
a. The lag time \(L\) and the reaction rate \(R\) can be determined from the figure. Find the P, PI, and PID controller parameters using the Ziegler-Nichols reaction curve method.
b. Assume that the transfer function of the plant is \(3 /\left(10 s^{2}+8 s+1\right)\). Use MATLAB to plot the unit-step response of the closed-loop system with P, PI, or PID control.
Step by Step Answer:

This question has not been answered yet.
You can Ask your question!
Related Book For 

Modeling And Analysis Of Dynamic Systems
ISBN: 9781138726420
3rd Edition
Authors: Ramin S. Esfandiari, Bei Lu
Question Posted:
