

You work as a system analyst in the headquarters of your states highway patrol, which has field
Question:
You work as a system analyst in the headquarters of your state’s highway patrol, which has field offices throughout the state. Currently, traffic accident reports are handwritten in the fi eld by the highway patrol officers, reviewed by their sergeant, stored temporarily, then batched and sent monthly to headquarters. Each one is entered into a legacy mainframe system by key data operators, then after the reports from the patrol offices in each county have been input, a computer operator runs the edit program using JCL.
Reports with major errors or omissions are rejected and returned to the county highway patrol office of origin for correction. After the edit program is completed for all the counties, an update program is run adding the monthly batch of traffic accident reports to the master file of reports. Statistical reports are generated quarterly and yearly. The entire process from the time the batches of reports are received to the point the master file is updated generally takes about three months. Executive management is interested in replacing the system with something that is more modern, less labor-intensive, more accurate, and easier for users to access and that will reduce turnaround time for preparing statistical reports.
Your assignment, as a member of the project team, is to prepare the feasibility study report (FSR).
a. What are some of the options or alternatives that you think should be considered? (Identify at least three in addition to “do nothing” or “maintain the status quo.”)
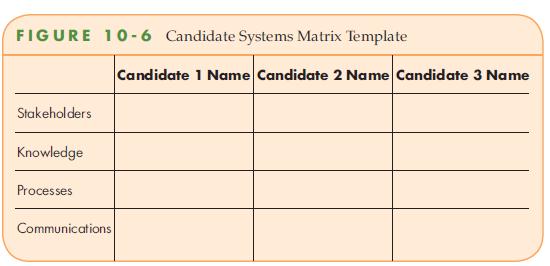
b. Prepare a candidate systems matrix describing the characteristics of each of these alternatives, using the candidate systems matrix template shown in Figure 10-6 .
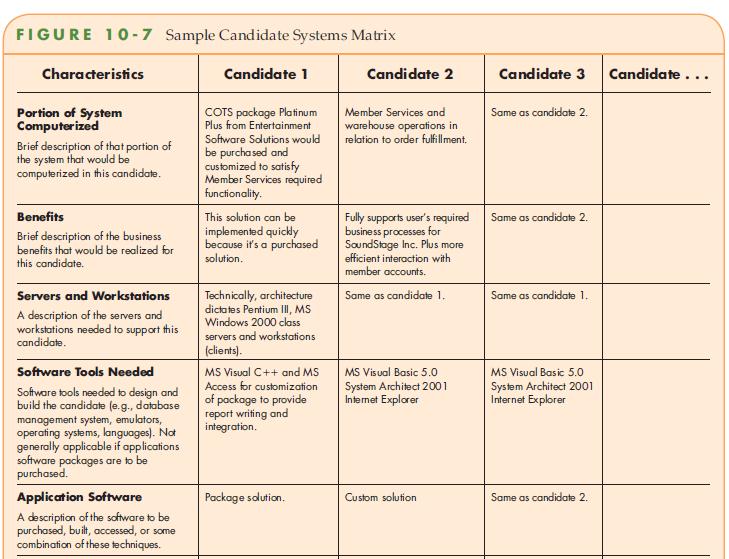
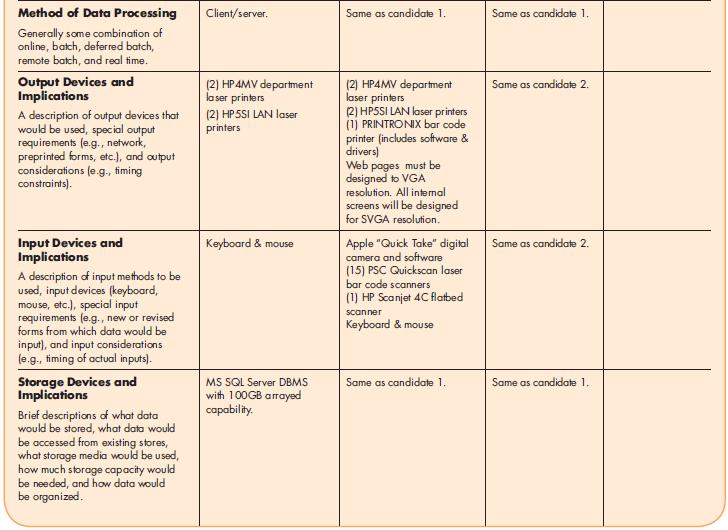
c. Expand the candidate systems matrix, using the template shown in Figure 10-7 .
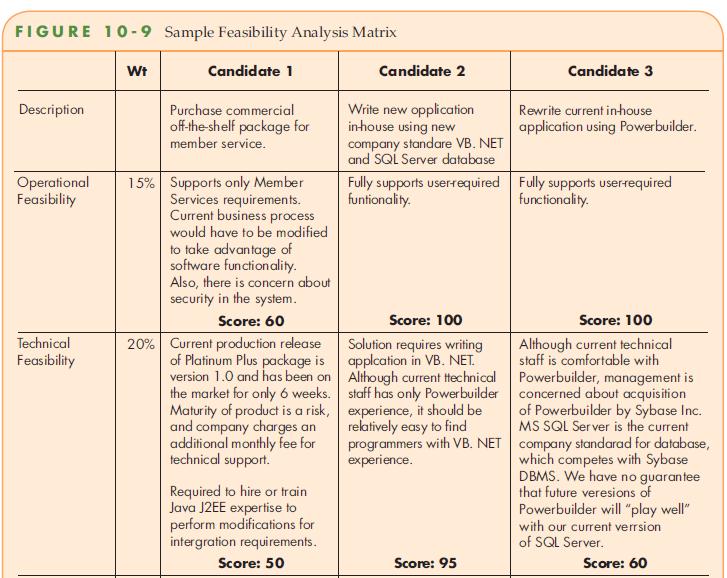
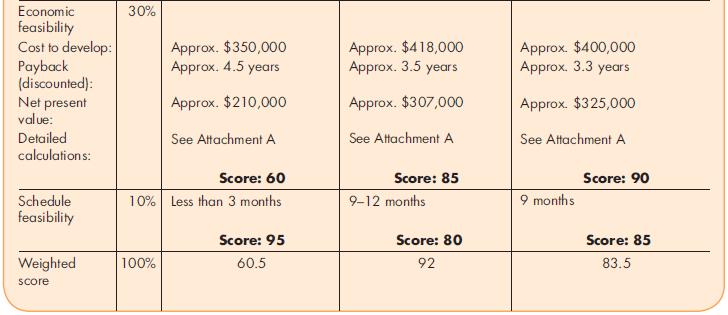
d. Evaluate each of these alternatives for operational, technical, and schedule feasibility, using the techniques described in the textbook and using the template shown in Figure 10-9 .
Data from Figure 10-6
Data from Figure 10-7
Data from Figure 10-9
Step by Step Answer:


Introduction To Systems Analysis And Design
ISBN: 9780073402949
1st Edition
Authors: Jeffrey Whitten, Lonnie Bentley
