

Attwood et al. (2012) measured whether the time taken to drink a beer was influenced by the
Question:
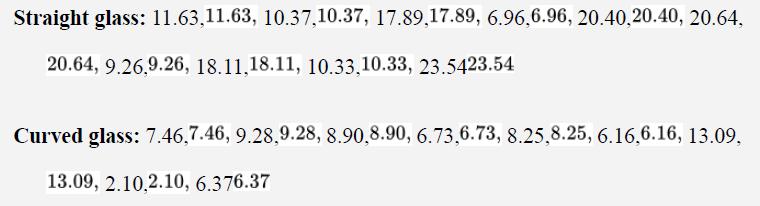
Attwood et al. (2012) measured whether the time taken to drink a beer was influenced by the shape of the glass in which it was served. Participants were given 12 oz. (about 350 ml) of chilled lager and were told that they should drink it at their own pace while watching a nature documentary. The participants were randomly assigned to receive their beer in either a straight-sided glass or a curved, fluted glass. The data below are the total time in minutes to drink the glass of beer by the 19 female participants in the study.
a. Show the data in a graph. What trend is suggested? Comment on other differences between the frequency distributions of the two samples.
b. Test whether the mean total time to drink the beer differs depending on beer-glass shape.
c. How much difference does it make? Provide a confidence interval of the difference.
d. A second test of the same hypotheses but using the data from male participants yielded the following results:
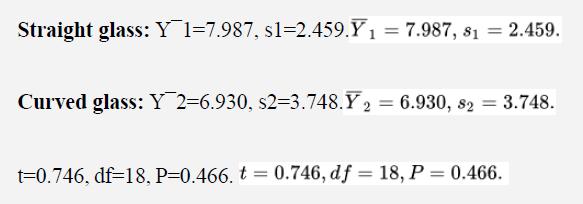
Is the following conclusion from the tests valid? “There is a significantly greater effect of beer-glass shape on mean time to drink in women than in men.” Explain.
Step by Step Answer:
Frequency Answer agraph the data use minitab to create a graph for two samples are given below Frequency 30 25 20 15 10 05 Histogram of Curved glass Normal 00 10 12 Girved glass 30 25 20 15 10 05 00 1...View the full answer


The Analysis Of Biological Data
ISBN: 9781319226237
3rd Edition
Authors: Michael C. Whitlock, Dolph Schluter
