

Calculating the year of birth of cadavers is a tricky enterprise. One method proposed is based on
Question:
Calculating the year of birth of cadavers is a tricky enterprise. One method proposed is based on the radioactivity of the enamel of the body’s teeth. The proportion of the radioisotope 14C in the atmosphere increased dramatically during the era of aboveground nuclear bomb testing between 1955 and 1963. Given that the enamel of a tooth is non-regenerating, measuring the 14C content of a tooth tells when the tooth developed, and therefore the year of birth of its owner. Predictions based on this method seem quite accurate (Spalding et al. 2005), as shown in the accompanying graph. The xaxis is Δ14C, which measures the amount of 14C relative to a standard (as a percentage).
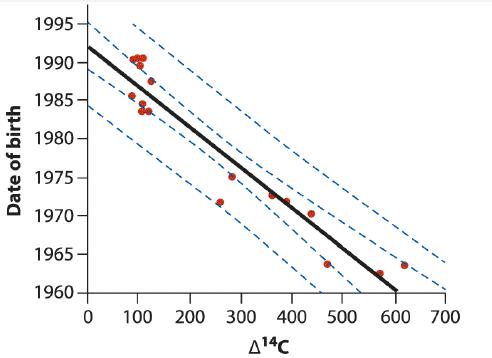
There are three sets of lines on this graph. The solid line represents the least squares regression line, predicting the actual year of birth from the estimate based on amount of 14 C. One pair of dashed lines shows the 95% confidence bands, and the other shows the 95% prediction interval.
a. What is the approximate slope of the regression line?
b. Which pair of lines shows the confidence bands? What do these confidence bands tell us?
c. Which pair of lines shows the prediction interval? What does this prediction interval tell us?
Step by Step Answer:
Based on the description of the image and the information provided a The approximate slope of the re...View the full answer


The Analysis Of Biological Data
ISBN: 9781319226237
3rd Edition
Authors: Michael C. Whitlock, Dolph Schluter
