

For each of the graphs shown below, based on hypothetical data, identify the type of graph and
Question:
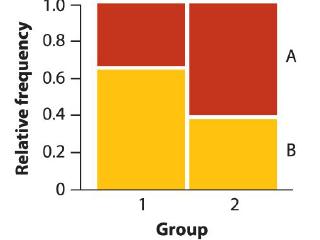
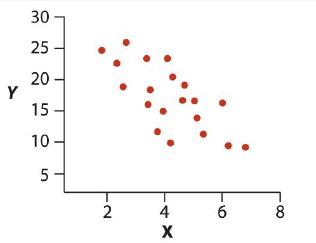
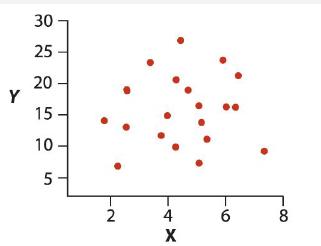
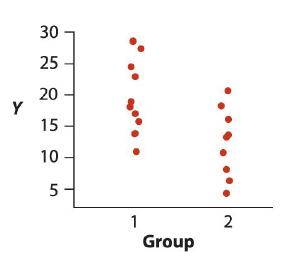
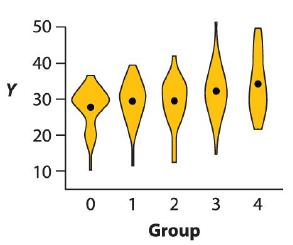
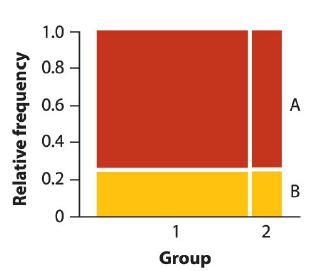
For each of the graphs shown below, based on hypothetical data, identify the type of graph and say whether or not the two variables exhibit an association. Explain your answer in each case.
(a)
(b)
(c)
(d)
(e)
(f)
Fantastic news! We've Found the answer you've been seeking!
Step by Step Answer:
a Mosaic plot Yes there is a clear difference betwee...View the full answer

Answered By
Daniel Kimutai
I am a competent academic expert who delivers excellent writing content from various subjects that pertain to academics. It includes Electronics engineering, History, Economics, Government, Management, IT, Religion, English, Psychology, Sociology, among others. By using Grammarly and Turnitin tools, I make sure that the writing content is original and delivered in time. For seven years, I have worked as a freelance writer, and many scholars have achieved their career dreams through my assistance.
1+ Reviews
10+ Question Solved
Related Book For 

The Analysis Of Biological Data
ISBN: 9781319226237
3rd Edition
Authors: Michael C. Whitlock, Dolph Schluter
Question Posted:
