

Mehl et al. (2007) wired 396 men and women volunteers with electronically activated recorders that allowed the
Question:
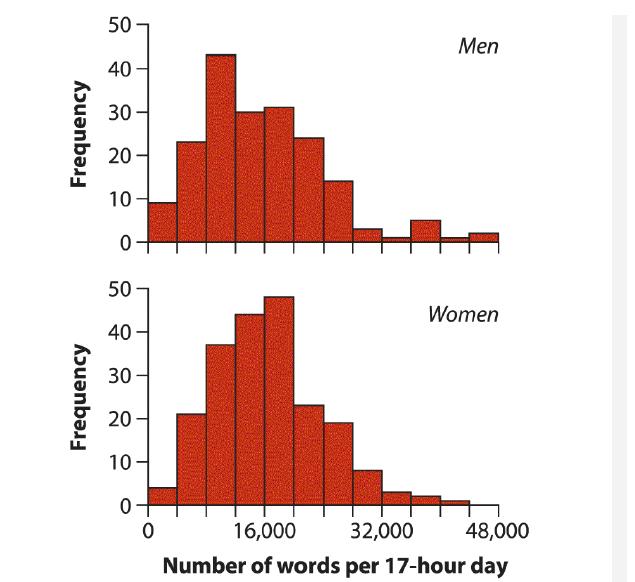
Mehl et al. (2007) wired 396 men and women volunteers with electronically activated recorders that allowed the researchers to calculate the number of words each individual spoke, on average, per 17- hour waking day. They found that the mean number of words spoken was only slightly higher for the 210 women (16,215 words) than for the 186 men (15,669) in the sample. The frequency distribution of the number of words spoken by all individuals of each gender is shown in the accompanying graphs (data from Mehl et al. 2007):
a. What type of graph is shown?
b. What are the explanatory and response variables in the figure?
c. What is the mode of the frequency distribution of each gender group?
d. Which group likely has the higher median number of words spoken per day, men or women?
e. Which group had the highest variance in number of words spoken per day?
Step by Step Answer:
a Grouped histograms b Explanato...View the full answer


The Analysis Of Biological Data
ISBN: 9781319226237
3rd Edition
Authors: Michael C. Whitlock, Dolph Schluter
