

Refer to Assignment Problem 25. a. Illustrate the (transformed) data in a graph. Add means and error
Question:
Refer to Assignment Problem 25.
a. Illustrate the (transformed) data in a graph. Add means and error bars showing standard errors of means.
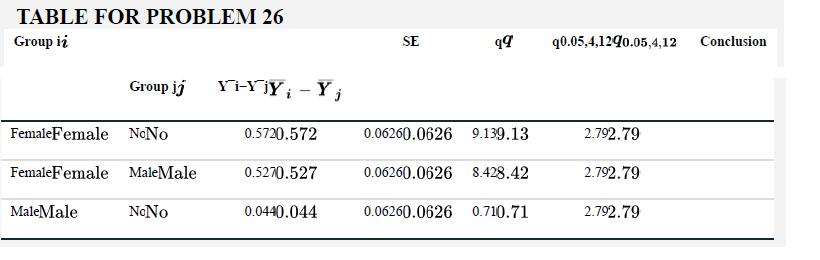
b. The table at the bottom of the page shows partial results of Tukey–Kramer multiple comparisons of means. Complete the table by adding the test conclusions.
c. Use symbols to illustrate the results of the Tukey–Kramer test. Add the symbols to your graph in part (a) to show which means group together on the basis of statistical significance.
Data from problem 25
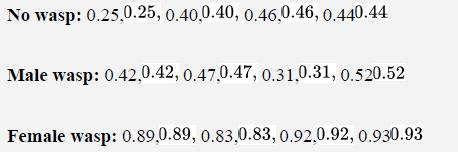
The parasitoid wasp, Leptopilina heterotoma, injects eggs into young larvae of fruit flies, Drosophila melanogaster. One reaction by the flies is to self-medicate by consuming alcohol (ethanol), which is naturally present in the decaying fruits where they live. The ethanol reduces oviposition by wasps, and it increases death rates of wasp larvae within parasitized flies. Kacsoh et al. (2013) investigated whether the presence of the wasp influences where female fruit flies prefer to lay their eggs. They presented female flies in cages with two dishes of fly food, one having 6% ethanol and the other with 0% ethanol. They recorded the proportion of eggs laid in the 6% ethanol dish when females were placed with female wasps, with male wasps, or with no wasps. The data below give the proportion of eggs laid in the ethanol dish for multiple replicates of each wasp treatment.
Step by Step Answer:
a For the illustration of the transformed data in a graph with means and error bars showing standard errors of means I will need to calculate the mean ...View the full answer


The Analysis Of Biological Data
ISBN: 9781319226237
3rd Edition
Authors: Michael C. Whitlock, Dolph Schluter
